This article was originally published to our newsletter subscribers. To receive our monthly reports on the 1st of each month, subscribe now for free.
Introduction
What a change from February! Just a month ago, we were loudly declaring the greenest ever month for Irish electricity. This month? Winds were low, the rivers seem to have run dry, and our prediction of a repeat in 2025 of two months in a row during which renewable generation exceeded that of fossil fuels certainly did not come to pass. March 2024 looks more like an outlier than the start of a long-term trend and, in the future, we may be better off thinking of March as an "in-between month": generally just too mild for either winter winds or summer solar to make much of an impact.
However, we don't have to be limited by the elements: as we reported at length last month, it was actually the new Greenlink interconnector that was largely responsible for the grid's greenest ever month. It was hard at work ferrying electrons across the Irish Sea and helping push domestic fossil fuel generation to near-record lows for this time of the year despite average winds. Add a bunch of new solar capacity which is already resulting in peak output records and we do have some good news for you. That's one prediction of ours - from January - that did come true.
Renewables
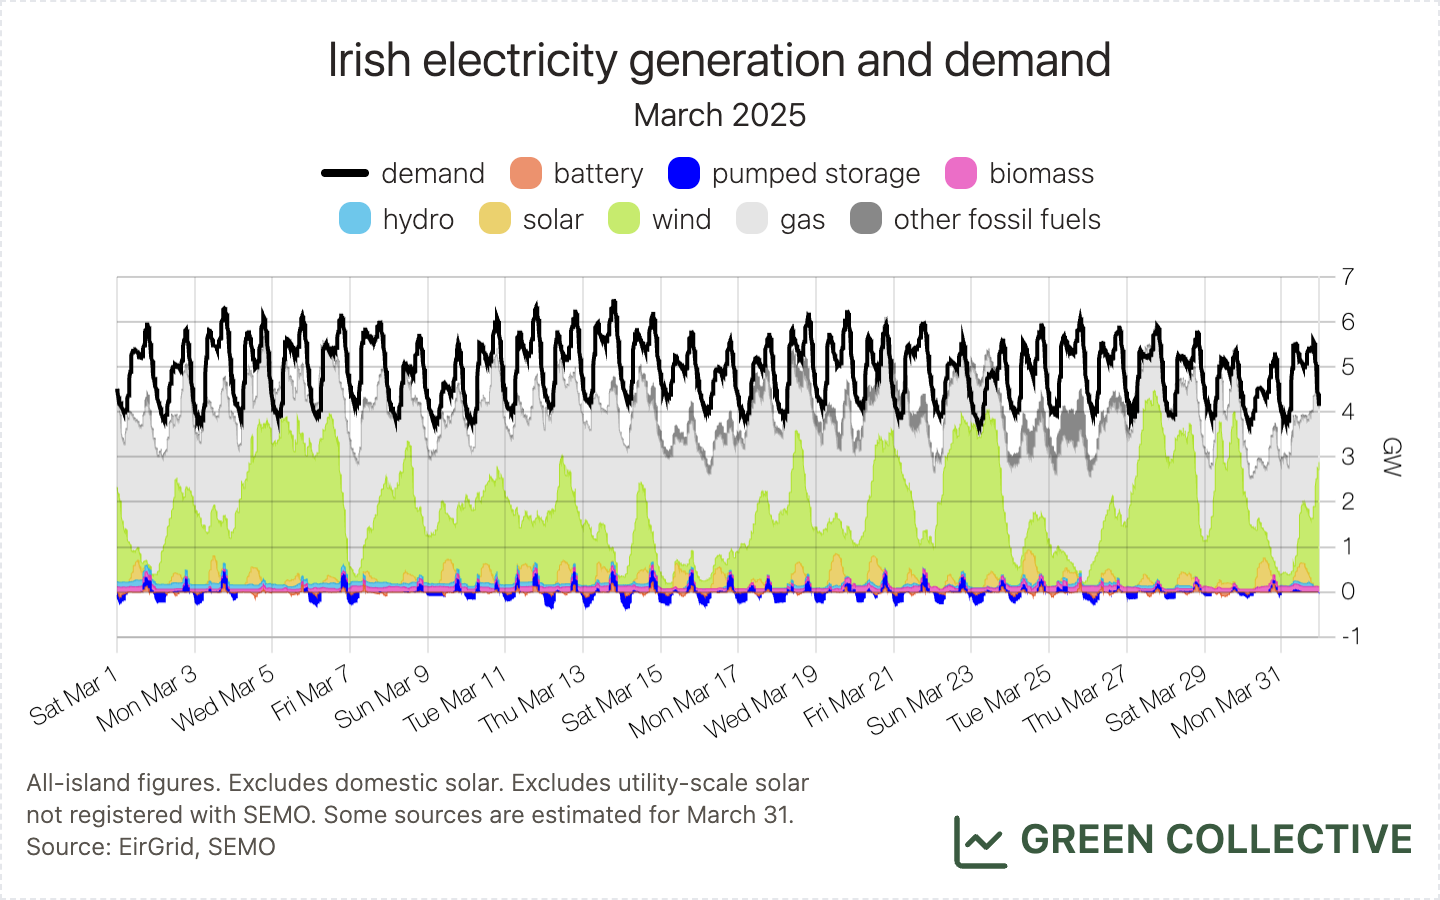
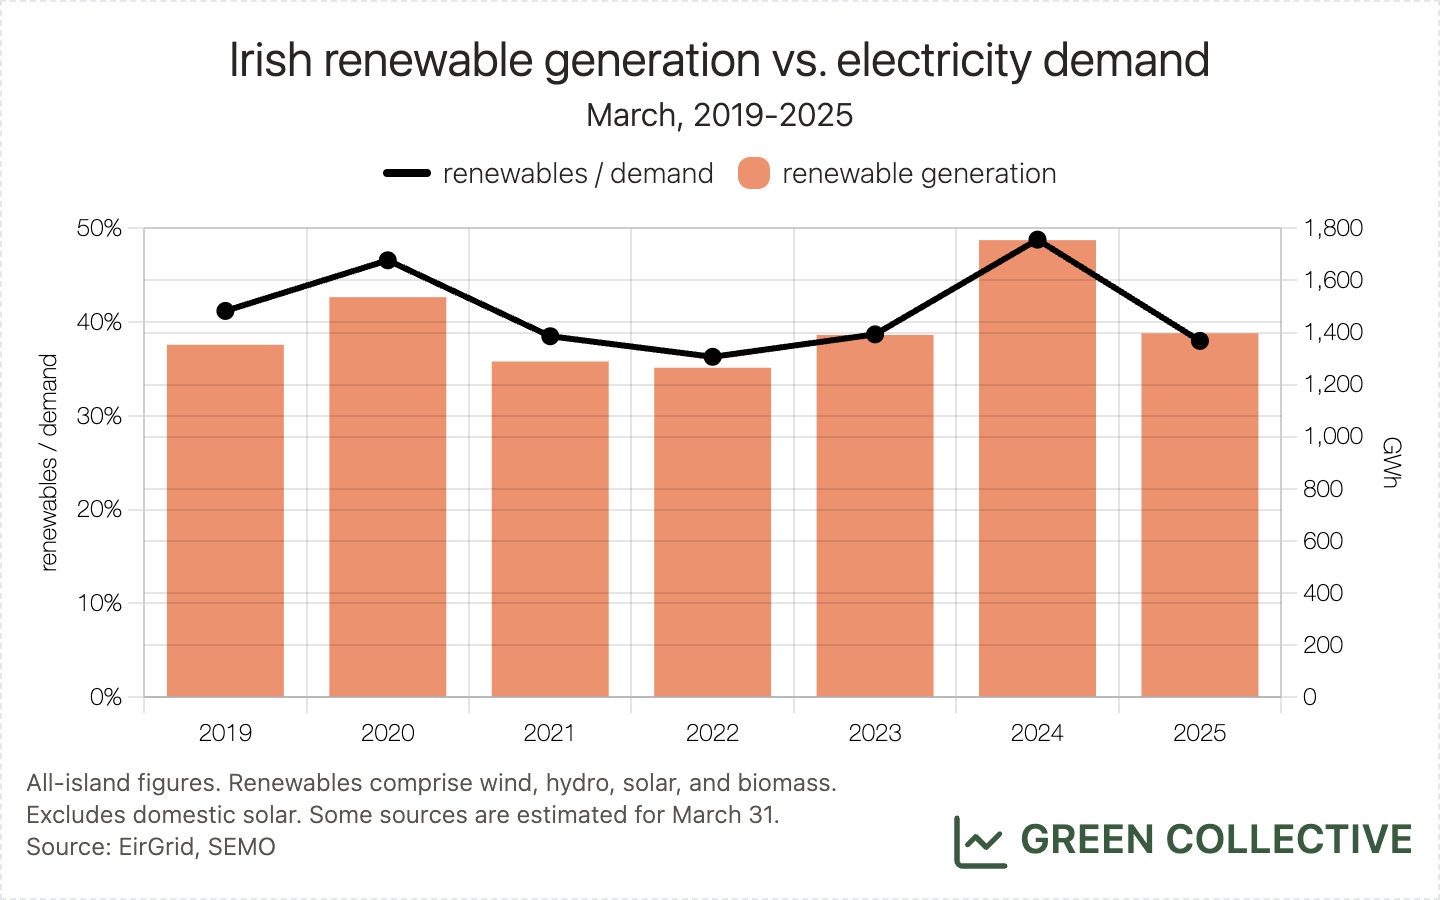
Renewable generation during March 2025 was equivalent to 38% of all-island electricity demand:
- 32.7% wind
- 2.3-2.5% solar
- 1.9% biomass
- 1.1% hydro
1397GWh from renewable sources was a sharp year-on-year reversal from March 2024's record-breaking 1755GWh and represents a return to the 1300-1400GWh March figures for renewables we first saw as long ago as 2019.
Winds were below normal and of course as wind power comprises the overwhelming majority of renewable generation, this is largely responsible for a lacklustre month. More on that below. However, we should note that hydro was exceptionally low: 41.9GWh was little more than one third of March 2024's 111.2GWh and in fact is the lowest ever hydro figure for the first three months of the year. This unfortunately largely offset an exceptional month for solar, more on which later.
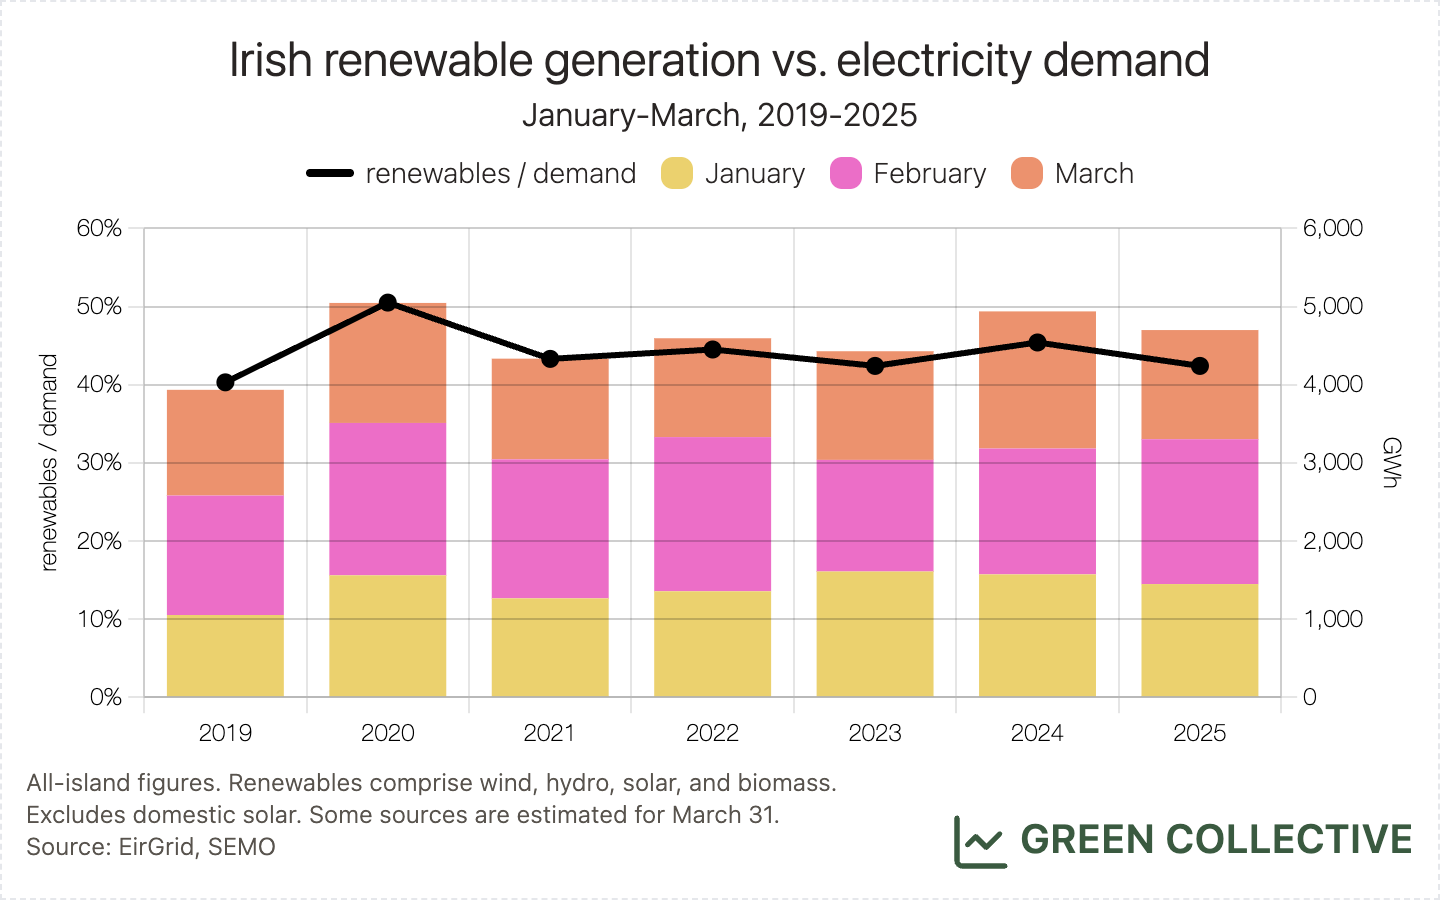
Renewables have now met 42.4% of the island's demand during the first three months of the year. Thanks to a strong February this is only a couple of percentage points less than Q1 2024; however, it's also only a couple of percentage points more than Q1 2019 and generally Q1 growth has remained flat since 2019.
Wind
1202.6GWh was the 5th-highest figure for wind power we've seen during a March month, marginally higher than 2021 and 2022's 1189GWh and 1159GWh, respectively. Gradually rising electricity demand means this equalled 32.7% of the month's electricity demand, only the 7th-highest ever ratio for a March month. March wind power, in particular, has remained flat since 2017 when it already reached 28.6% of electricity demand.
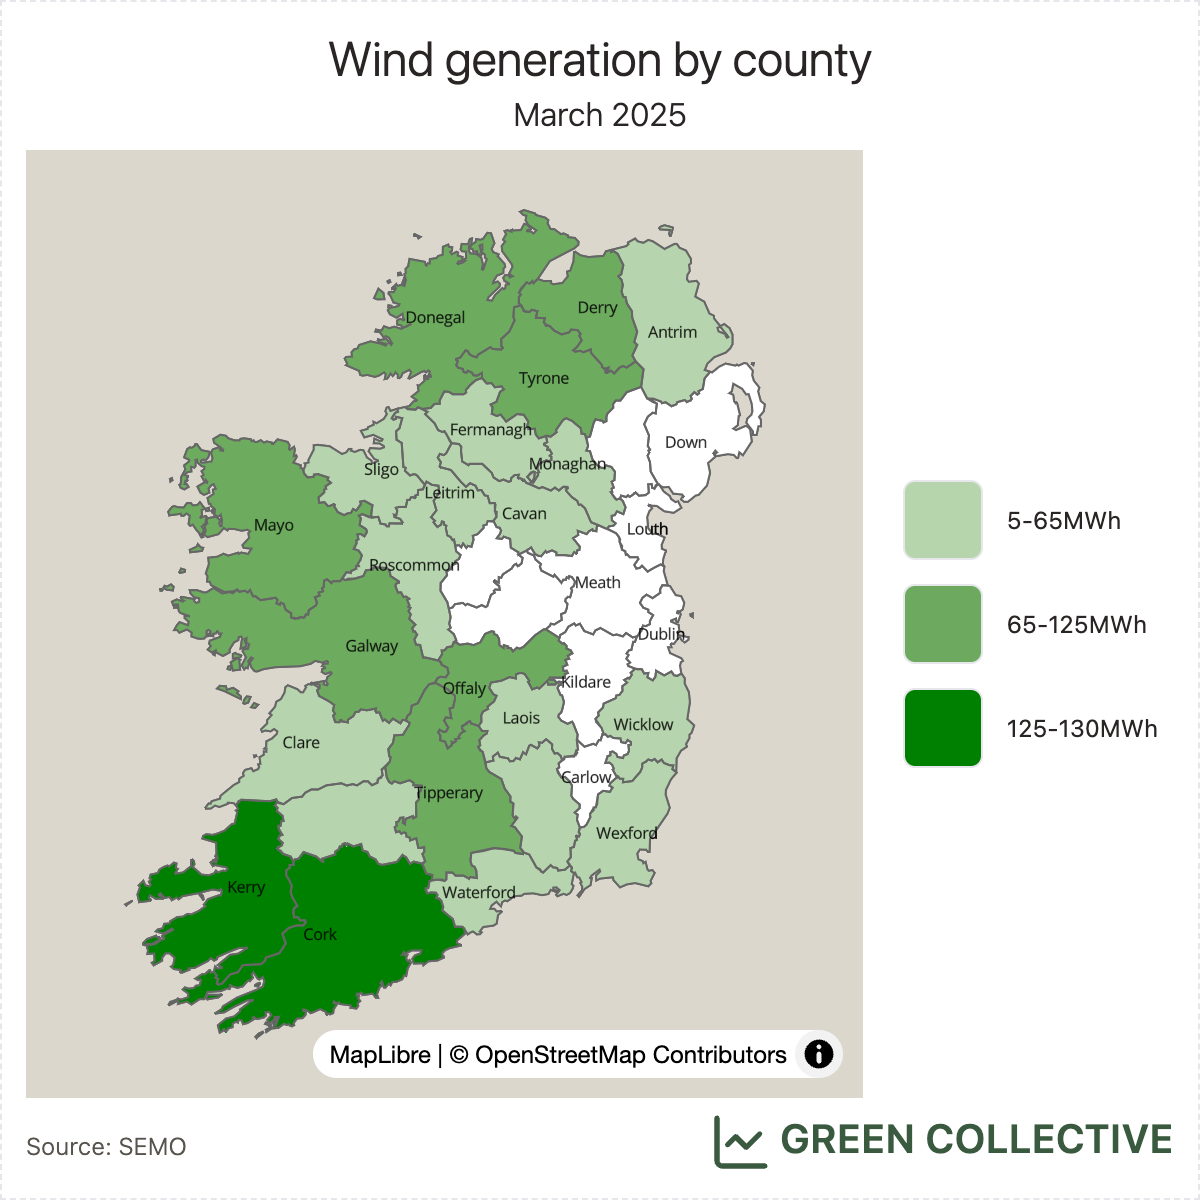
The top wind-producing counties during March 2025:
- Kerry (135GWh)
- Cork (125GWh)
- Galway (89GWh)
- Mayo (87GWh)
- Offaly (81GWh)
These are the same top counties as last month, with just a slight re-ordering in positions 1-5. With Offaly home to the majority of 2024's new wind capacity, it looks set to stay in the top 5 for the foreseeable future.
Dispatch down wise, we estimate all-island wind dispatch down was 8.4% during March 2025.
Solar
Back in January we predicted, given all the new capacity that came online over the winter, we would see a new solar output record before the summer hit. This has come to pass, with the solar output record being broken twice late in the month:
- On March 19, solar output from those solar farms participating in the market reached 715MW at noon.
- On March 24, those same "market" solar farms reached an output of 732MW at 1.30pm.
With approximately 85% of utility-scale solar capacity reporting to SEMO these days, we will likely be able to revise these figures upwards to approximately 820MW and 840MW, respectively, once EirGrid publishes utility-scale data (usually towards the end of the following month, i.e. late March).
2025 is the third year with significant solar capacity and growth on the Irish grid and it's clear now that the "solar record season" runs roughly March-September and is steadily expanding. In other words, even in Ireland solar is a significant source of power for more than six months of the year; indeed, it was the third largest power source during March after gas and wind.
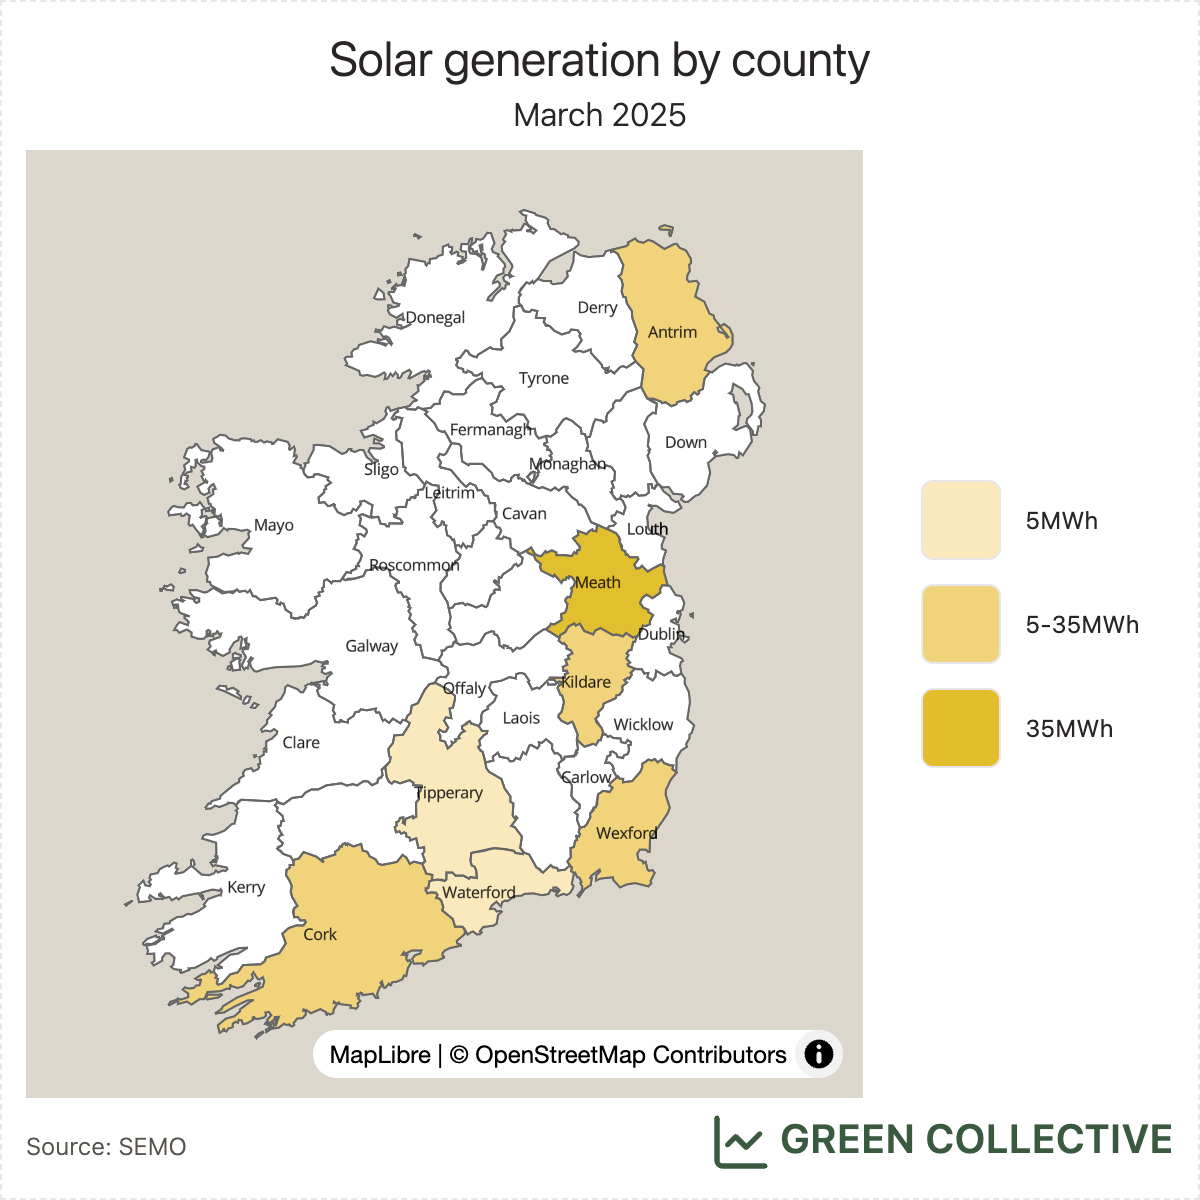
The top solar-producing counties during March 2025:
- Meath (37GWh)
- Wexford (17GWh)
- Kildare (10GWh)
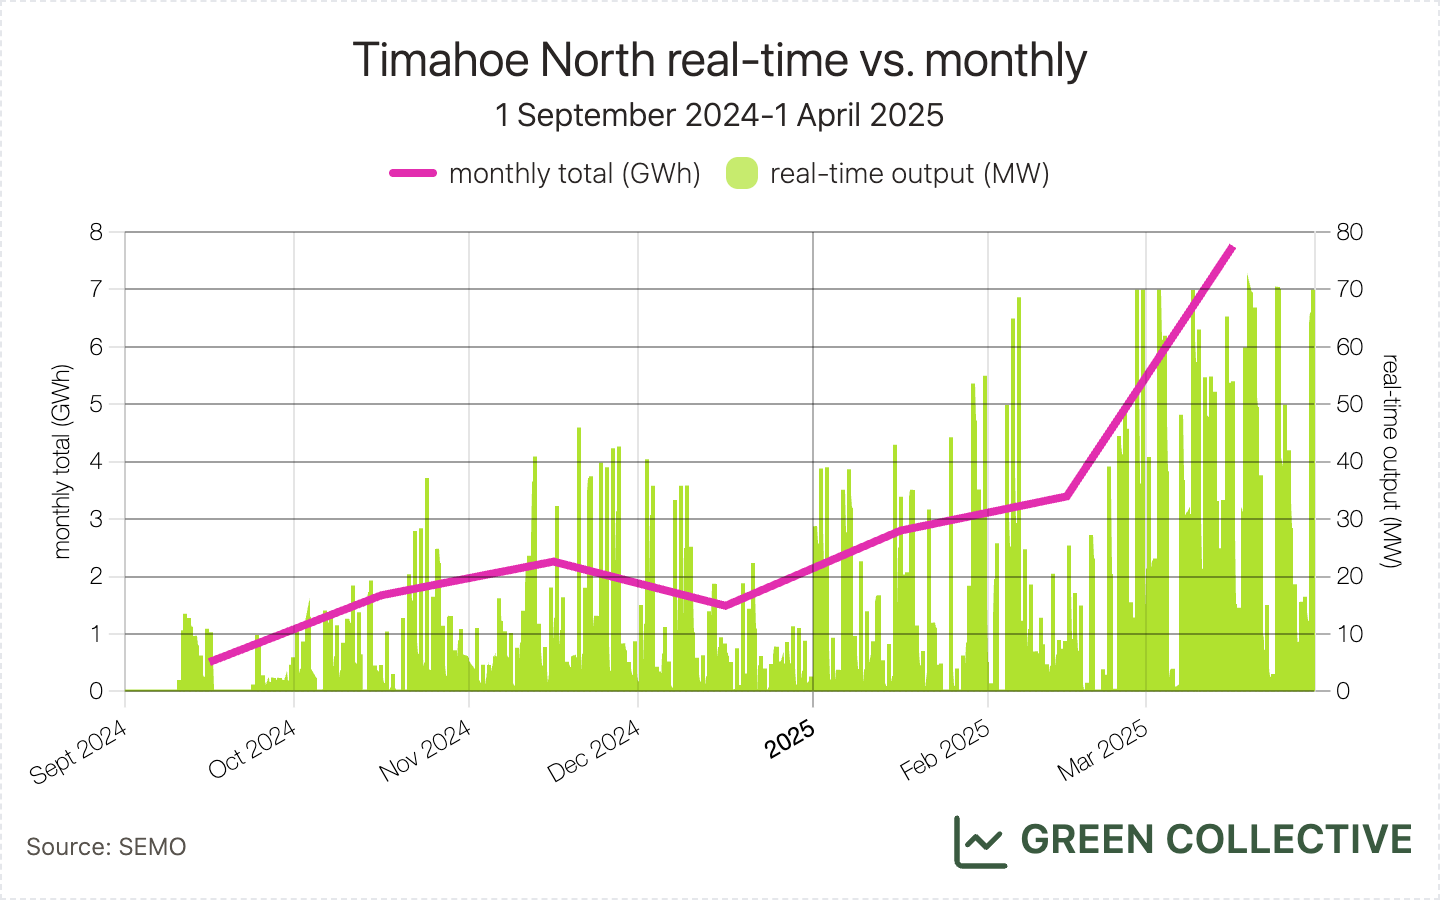
This month, Kildare displaced Cork to enter the top-three for the first time. We can attribute this to the new Timahoe North solar farm which powered up in September and this month started regularly reaching its Maximum Export Capacity (MEC) of 70MW.
Crunching the numbers, we can see that the two other smaller solar farms which first powered up over the winter are now also regularly reaching their peak capacity:
- Gaskinstown, Meath (23MW)
- Monaraha, Tipperary (21MW)
That's approximately 110MW of new solar capacity in the six months that have passed since the last solar output record on August 31 2024. Back then, output reached 719MW; we're pleased to see that that plus recent capacity is approximately equal to our current estimate of the all-time high (see above), of 840MW.
Fossil Fuels and CO₂ Emissions
Fossil fuel generation during March 2025 was equivalent to 44.6% of all-island electricity demand:
- 41.8% gas
- 1.5% coal
- 0.8% oil
- 0.7% waste-to-energy
1640GWh of fossil fuel generation was higher than 2024's record low of 1508GWh but is nevertheless the second-lowest figure we've seen in a March month. Similarly, the 44.6% share of demand this equalled was also up from 2024's all-time low of 41.9% but is nevertheless the second-lowest ever monthly ratio for a March month.
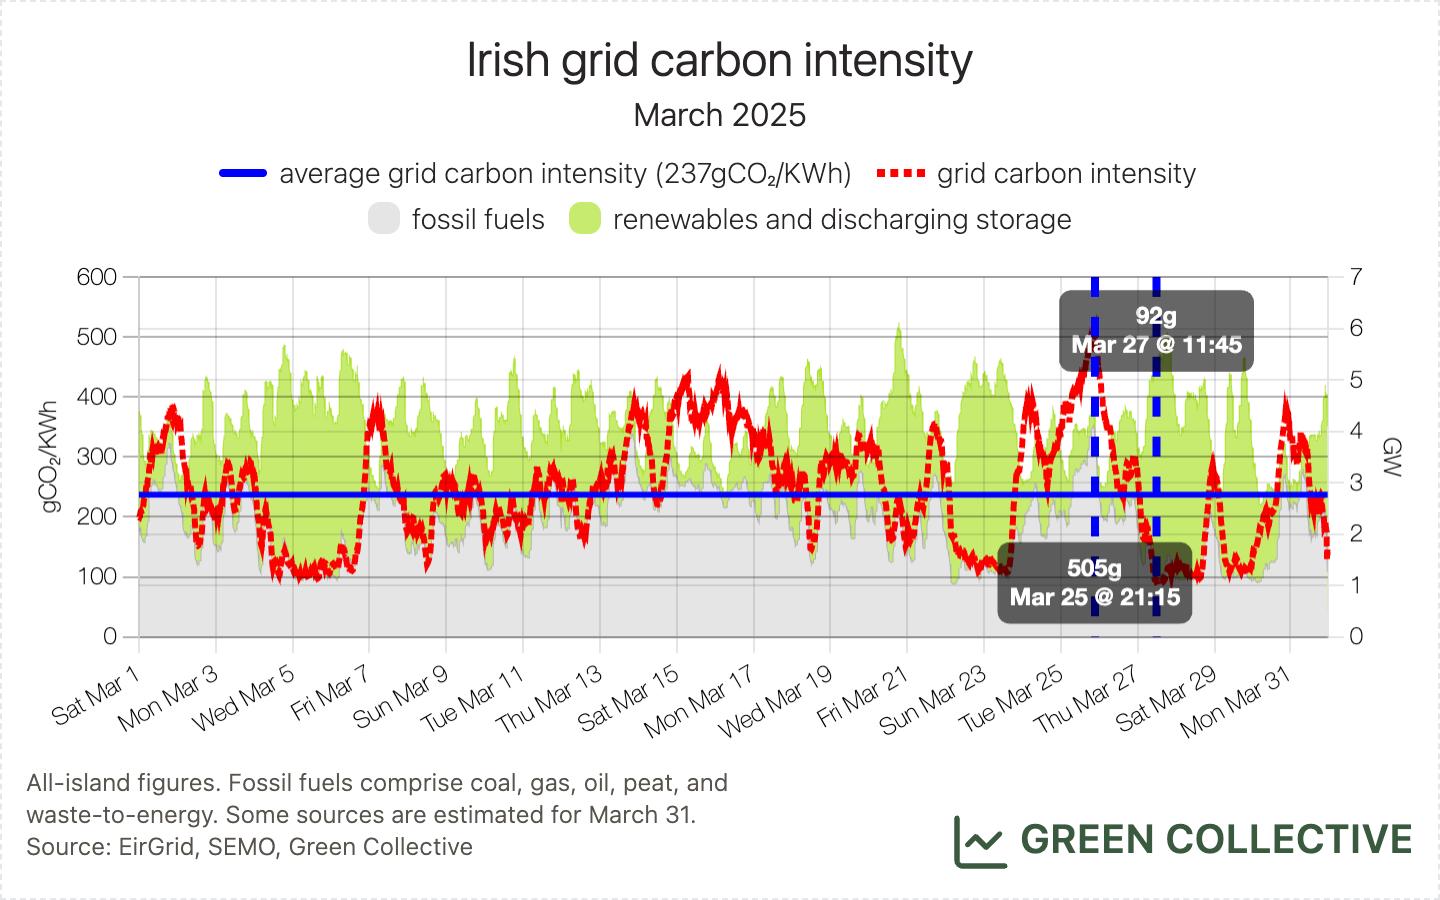
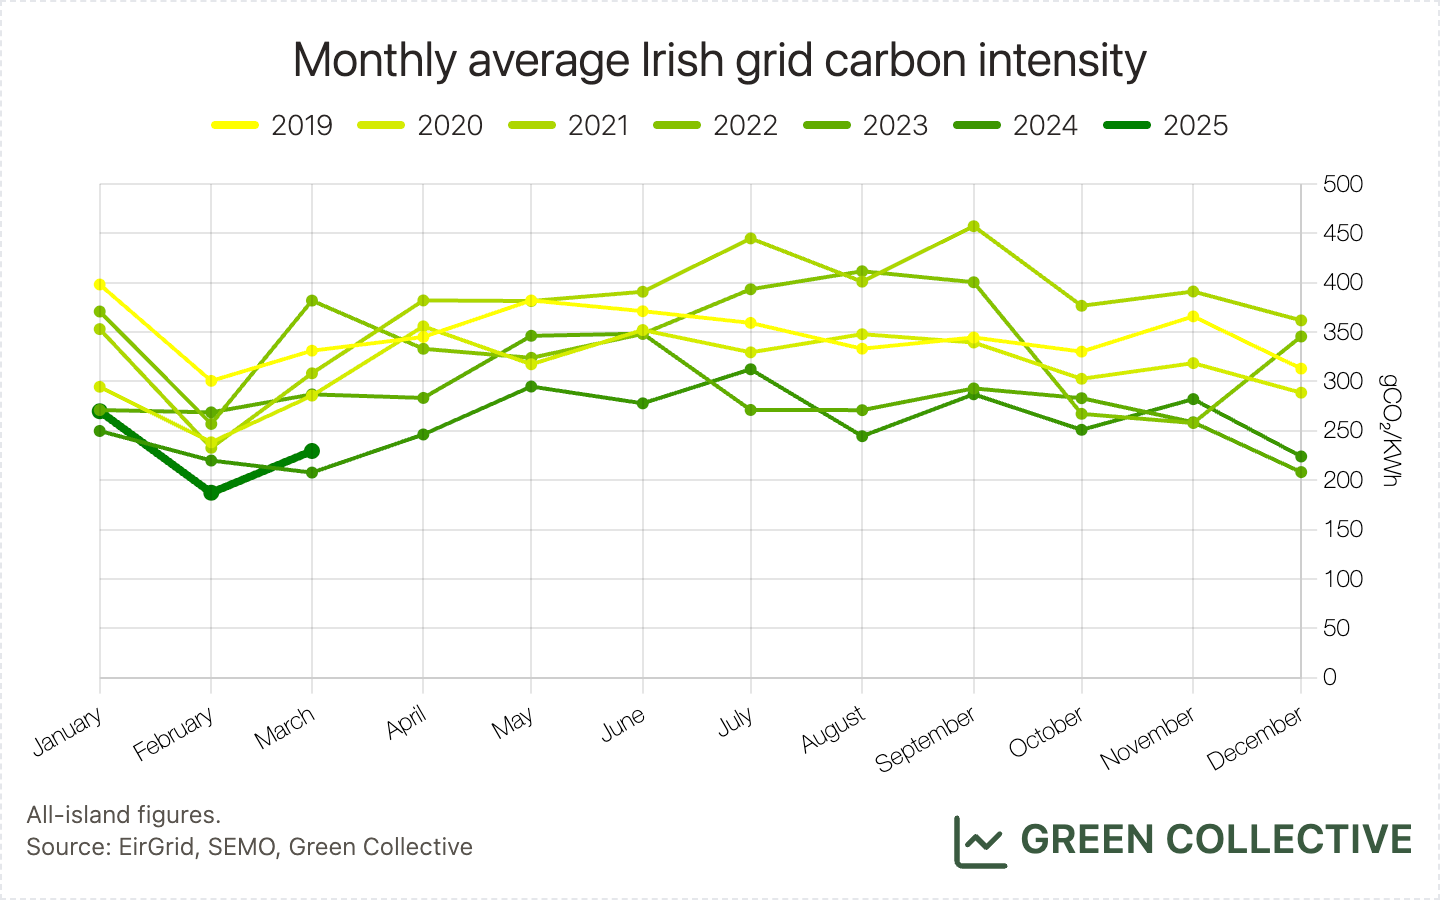
We estimate that for each kWh of electricity generated during March 2025 the Irish grid emitted between between 92g and 505g of CO₂, for an average of 237gCO₂/kWh. While hugely up from February's all-time monthly low of 187gCO₂/kWh and significantly up year-on-year from March 2024's 208gCO₂/kWh, this was nevertheless the second-lowest grid carbon intensity observed during a March month.
Treating the island as two separate grids for a moment, we estimate the Republic of Ireland averaged 236g while Northern Ireland averaged 240g.
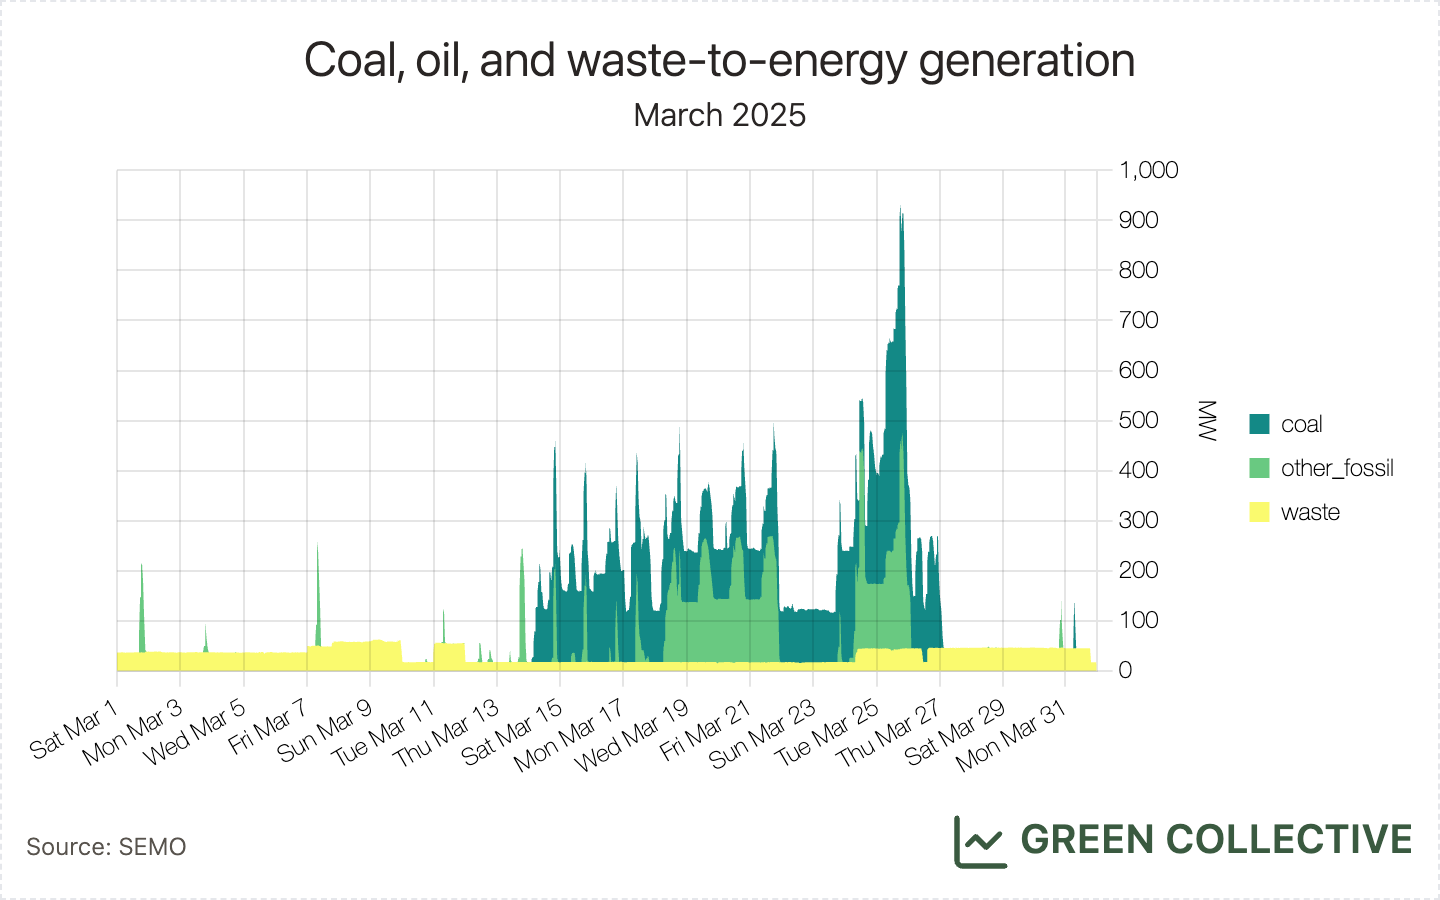
The dirtier fossil fuels - coal and oil - continue to fall in significance:
- 53.3GWh from coal generation was the lowest ever burned during a March month and in fact the fourth lowest we've ever seen in a single month.
- 28.2GWh from oil generation was well up from March 2024's 5.8GWh but low historically, and less than 10% of what it was in March 2019.
Almost all of the month's coal and oil generation occurred in the two weeks between from 14th-27th, inclusive, almost all occurred at Moneypoint, and reached a peak of over 900MW on Tuesday 25th March. It's not clear to us why gas capacity wasn't used at this time: there were other low-wind periods during the month without any coal or gas generation.
Imports/exports
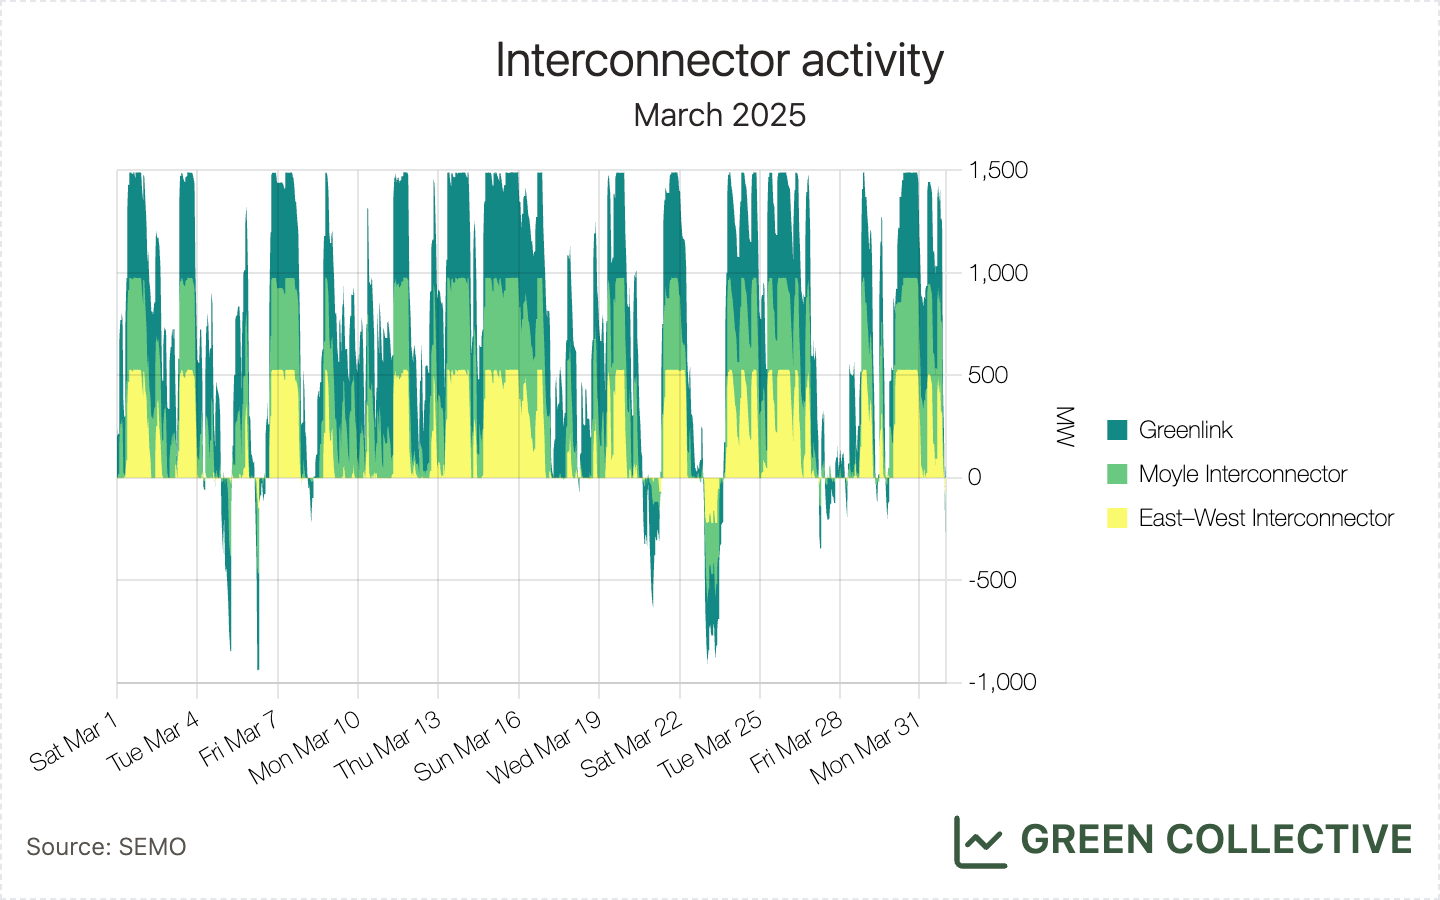
Last month, we wrote in detail about how the new Greenlink interconnector between Ireland and Wales was creating a "new normal" for Irish electricity and were able to present a slew of new import/export records. With renewable generation relatively low during March 2025, we're able to present several new export-related records:
- 635.1GWh of electricity was imported into the island, the most ever during a single month. This was equivalent to 17.3% of electricity demand, also a new record.
- Net imports were 606GWh, the most ever during a single month. This was equivalent to 16.5% of demand, beaten only by July 2024's 16.7%.
- On March 15, the island imported 34.1GWh of electricity. This was the most ever imported in one day. No less than seven of the top-ten ever days for imports (in terms of GWh) occurred during March 2025; the remaining three occurred in February 2025.
- On March 30, 30.9% of the island's electricity demand was imported. This was the highest ever ratio of imports in a single day and beaten only by gas' 38.7% share.
While we very much look forward to a future in which Ireland is a net exporter of (renewable) electricity, importing from the cleaner GB grid is, for now, without a doubt helping reduce the island's carbon emissions.
Storage
As in February, our records tracker didn't detect any new records from battery discharges during March 2025. These records will only appear when more batteries participate in wholesale trading. Here is a monthly comparison which shows how SNSP (system non-synchronous penetration, essentially levels of non-synchronous generation like wind and solar plus interconnector activities) and wholesale electricity prices determine whether batteries would choose to remain available for ancillary services or participate in wholesale trading. The comparison between January and February 2025 also demonstrates there is much room for improvement for optimising battery operations.
It's important to remember that battery revenues from ancillary services are largely tied to SNSP: when SNSP is less than 50%, potential revenue from ancillary services, aka the DS3 Programme, drops significantly for batteries. Higher SNSP translates to higher revenues when batteries maintain a high level of state of charge, in order to provide services within the DS3 Programme. However, grid operators reduced overall revenue potential for batteries providing ancillary services as of October 2024. Since then, we have seen more batteries opting out of DS3 (it's not as lucrative as before October 2024) and participating in wholesale trading instead, which shows up on our charts as battery discharge records.
The chart below shows all-island battery discharges, along with fluctuations in SNSP and wholesale electricity prices, during January 2025. When batteries discharge at extra high levels (e.g. peak evening hours on January 8, 9, and 20), SNSP levels were much lower than average and wholesale prices were high. Therefore, it makes sense financially for these storage systems to drain the batteries and sell electricity while prices are high, when revenues from wholesale trading are likely higher than ancillary services from the DS3 Programme during peak hours.

The same chart for February below shows SNSP levels were high for most of the month. The mostly inverse relationship between SNSP and wholesale prices are even clearer in February than in January. Similar to January, higher battery discharges also occurred when SNSP was relatively low and wholesale prices relatively high. Since wholesale prices are generally lower in February than in January, some batteries probably didn't bother to switch from being available for DS3 to participating in wholesale trading, which led to no records in February.
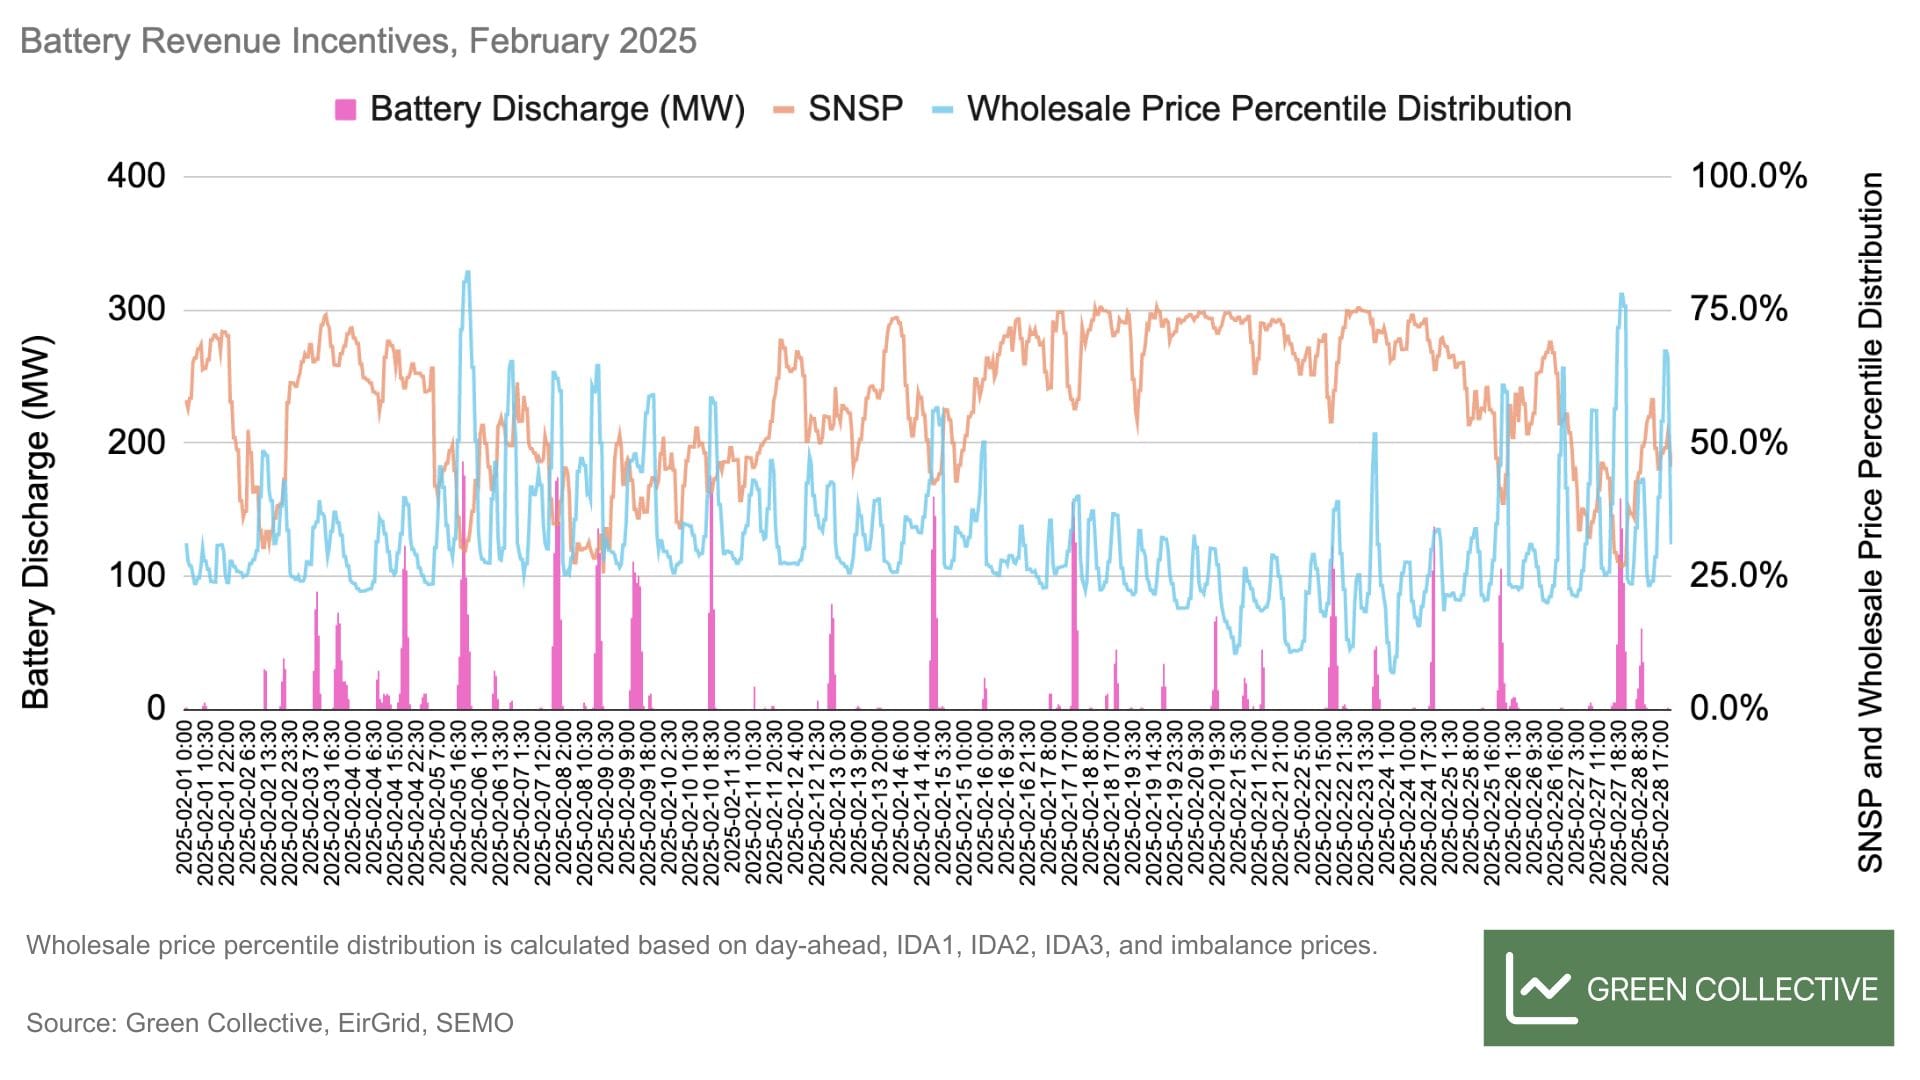
However, you might notice the combination of SNSP and wholesale prices don't explain all battery discharge patterns shown above. Sometimes batteries don't discharge as much as expected even during low-wind hours with high prices; sometimes discharges take place despite relatively high SNSP and unremarkable prices. We believe these inconsistencies illustrate the lack of dynamic trading capabilities. Not all asset operators can optimise batteries dynamically on a continuous basis. There is also room for improvement on the side of grid operator: the current scheduling and dispatch system needs to be updated, in order to better use batteries on the Irish grid.
Before these challenges are addressed to make batteries more dynamic, it's hard to predict when the next battery discharge record will appear. Of course, we will continue to track them on our records dashboard and will keep an eye on how revenue stacking is changing for battery energy storage in Ireland.
Hatches and Dispatches
- In early March, the Government approved a plan to develop a liquified
natural gas (LNG) terminal. The Government, as expected, emphasises energy
security, but the decision is at odds with electrification trends and the fact
that gas consumption in the power sector has been decreasing despite rising
demand levels, as the grid incorporates more wind, solar, batteries,
synchronous condensers, interconnectors, etc. It's also important to keep in
mind more fossil gas guarantees higher power prices and higher bills. The
chart below clearly shows the correlation (and let's be real, causation)
between gas and electricity prices. We should have made this chart a long time
ago, but only did so after seeing this
visualisation
of gas and power prices in the UK market from Simon Evans of Carbon Brief.
However, better late than never and hopefully this is useful if anyone needs
to "tap the sign" during discussions about this seemingly unnecessary LNG
terminal in Ireland.

- Grange Backup Power Limited registered six generators with SEMO in March. We regularly check the list of registered units from SEMO to make sure our database covers generating capacity on the island comprehensively. Six new generators named "Grange" showed up in March and we believe it's a 100MW+ gas peaker plant at the Grange Castle Business Park developed by SDCL. Initially we mistook it for the 170MW backup gas generator to be constructed by Microsoft also at Grange Castle. We were puzzled because the Microsoft plant is supposed to be for backup purposes only and shouldn't export to the national grid, so they shouldn't show up as registered units with SEMO. This leads to a separate issue of the lack of transparency in backup generator capacity built entirely for data centres and their fossil fuel consumption. It turns out Grange Castle is a complicated case full of data centres owned by various entities, as well as the location for this latest gas peaker plant in Ireland developed by SDCL. So far these new units haven't had any metered generation, but we will be tracking their fossil fuel consumption and impact on grid carbon intensity while revising the gas generating capacity in our database.