This article was originally published to our newsletter subscribers. To receive our monthly reports on the 1st of each month, subscribe now for free.
Note: This article was updated March 10th, 2025, to correct the tonnes of CO₂ emitted and again on March 26th, 2025, to incorporate full utility-scale solar SCADA data from Eirgrid.
Introduction
Greenlink is creating a new normal for carbon emissions in Irish electricity. The interconnector between Ireland and Wales entered the market just in time for what's traditionally been the strongest month here for renewable generation and it's had an immediate effect: average grid carbon intensity in February 2025 fell to 187gCO₂/kWh, a historic low! This is the single biggest infrastructural change on the grid since the synchronous condenser in 2022 and we are now seeing the grid getting greener in the face of rising demand.
Before diving into our regular programming, we would like to highlight two things on our end: an upcoming feature and a recent validation.
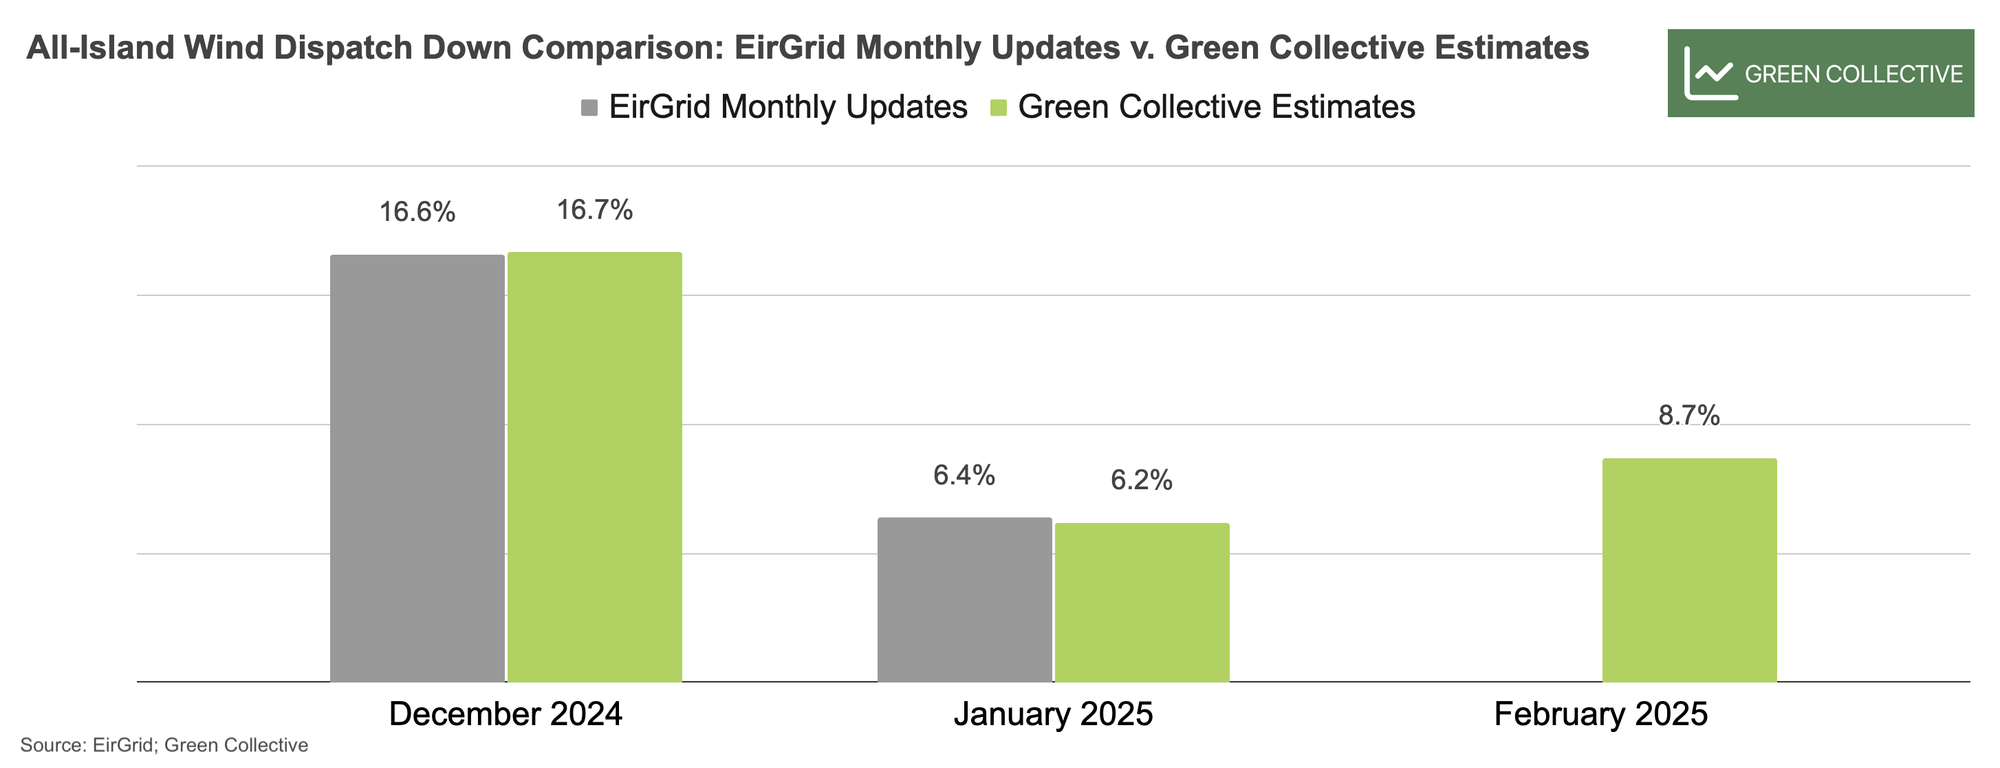
- Dispatch down estimates in the works: We have been busy parsing through
troves of data to have real-time dispatch down estimates, as EirGrid’s monthly
updates are usually delayed by a few weeks. So far, calibrations for December
2024 and January 2025 have been promising (shown on the chart below). Our
estimates show all-island wind dispatch down in February 2025 was 8.7%, but we
will have to wait for EirGrid releases later in March to see how we performed
in February, as we continue to revise our model.
- Green Collective’s grid carbon intensity estimates matched the preliminary 2024 emissions data from the Sustainable Energy Authority of Ireland (SEAI): Speaking of calibrations and measuring ourselves against data from official sources, the SEAI’s recently updated Monthly Electricity Statistics shows there were 7.3 million tonnes of CO₂ emissions from electricity generation in the Republic of Ireland (h/t Paul Deane on LinkedIn). We started estimating Irish grid carbon intensity in 30-minute intervals in 2024 and our annual average grid carbon intensity for the Republic of Ireland last year was 254gCO₂/kWh. With a total generation of 2.9TWh in 2024, this translates to 7.34 million tonnes of CO₂ emissions, which matches preliminary data from the SEAI almost exactly! Getting this validation also makes us feel more confident about our latest estimates mentioned above: February is the greenest month ever with a below 200gCO₂/kWh of monthly average grid carbon intensity for the first time. More details in the Fossil Fuels and CO₂ emissions section below.
Renewables
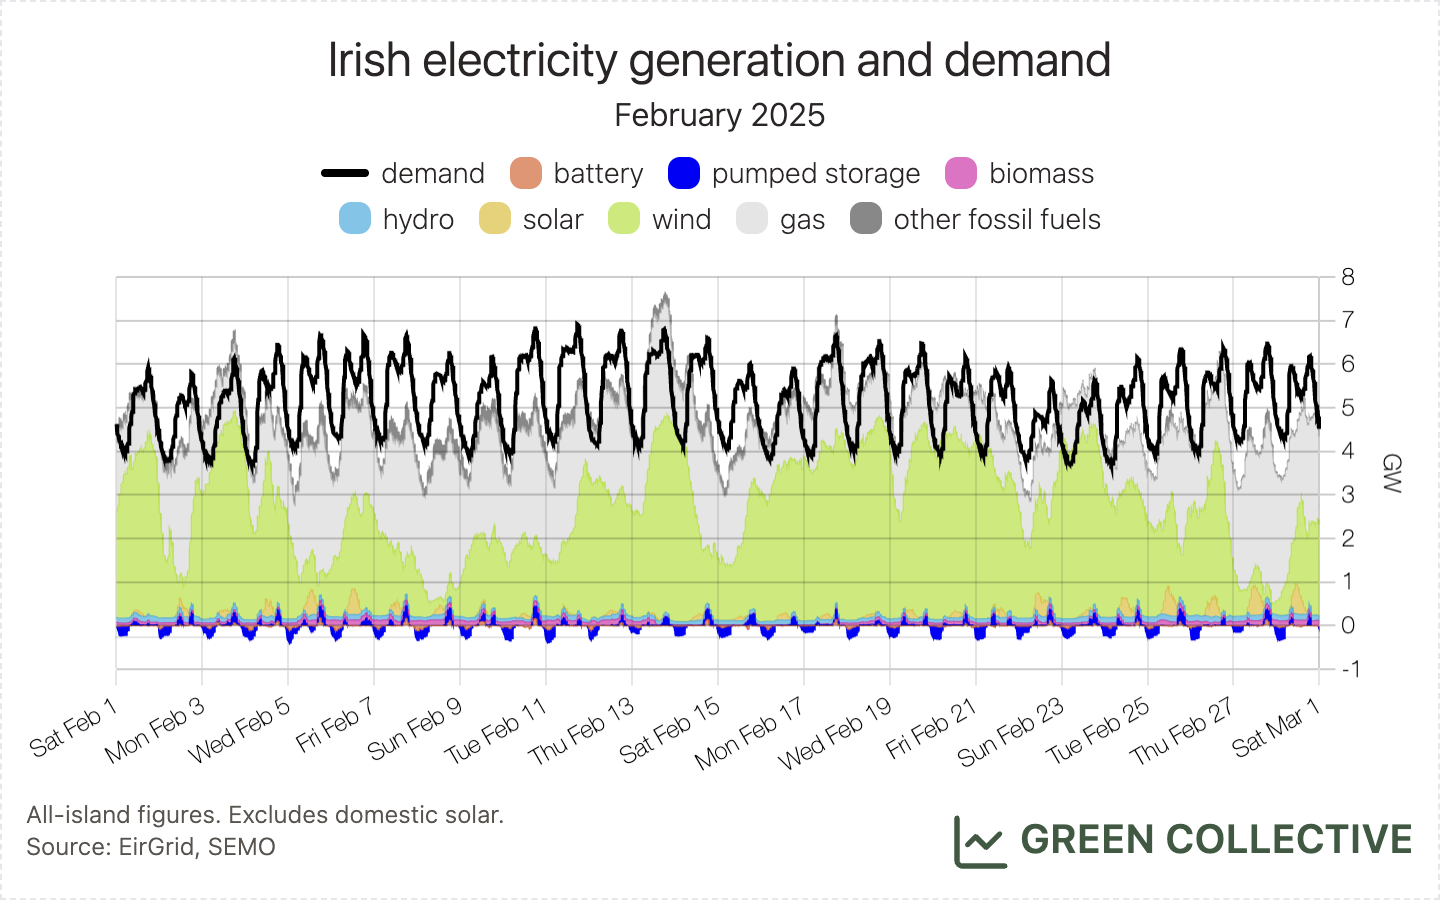
Renewable generation during February 2025 was equivalent to 53.1% of all-island electricity demand:
- 48.3% wind
- 2.1% hydro
- 1.5% biomass
- 1.2% solar
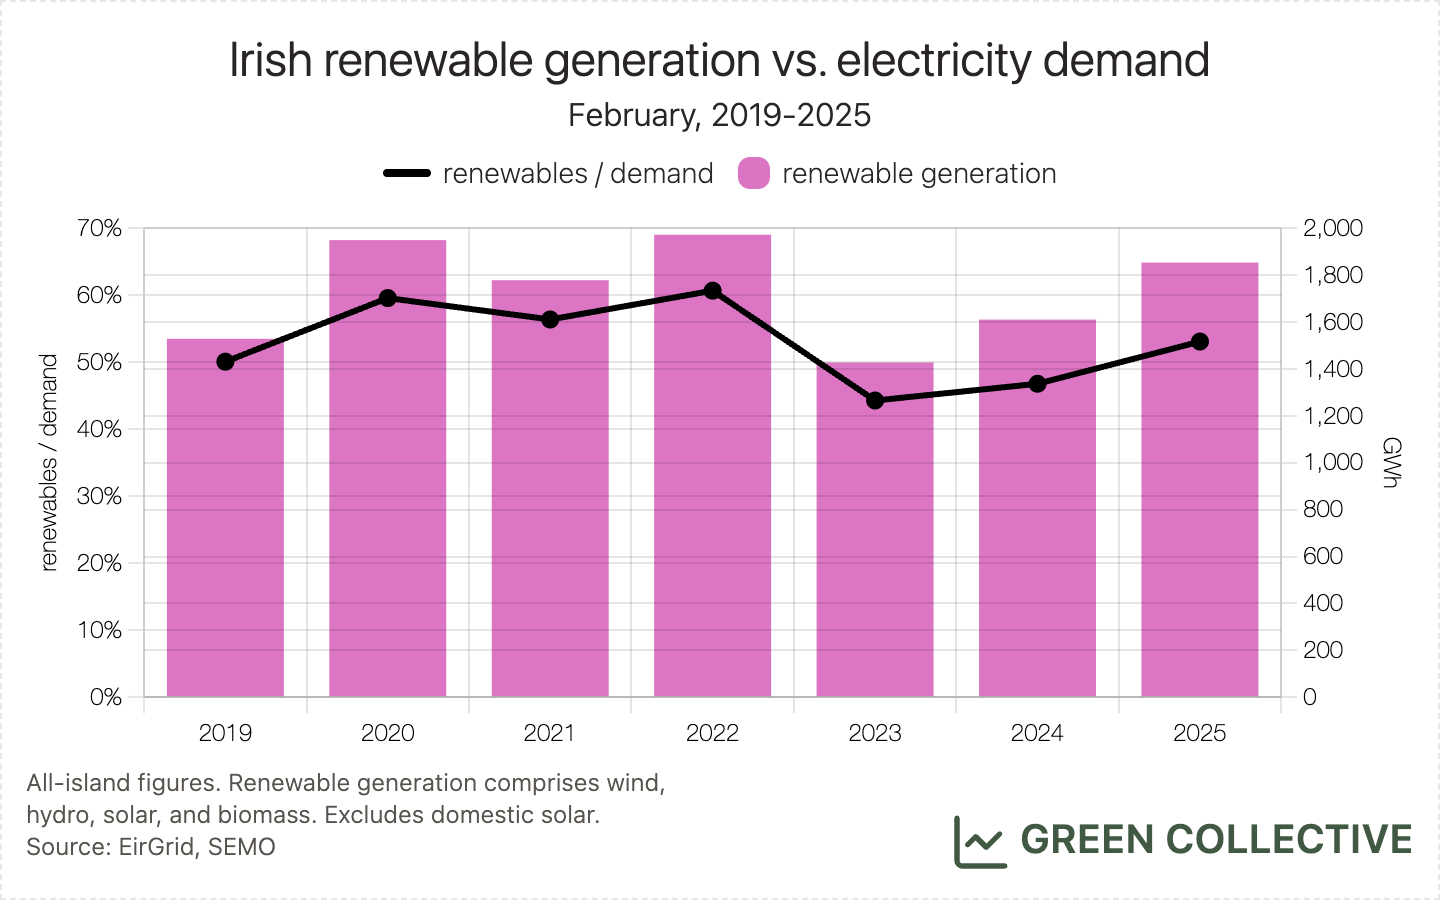
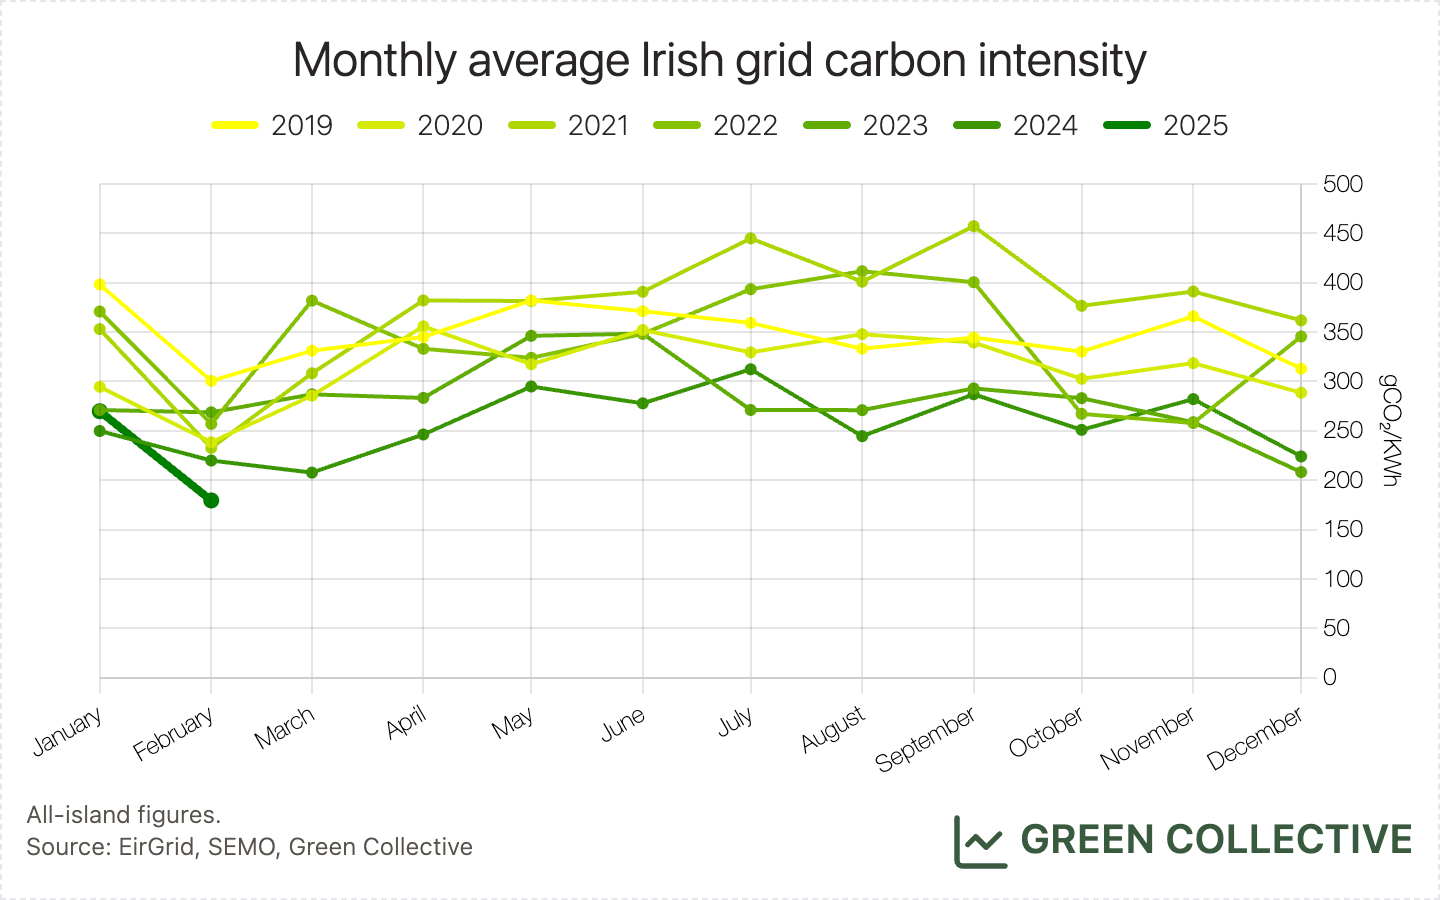
This was the first February month since 2022 in which renewable generation met the majority of demand. It's a welcome return to the 50%+ February months we first saw as long ago in 2019 despite February demand having grown 14% since then.
This was the first month since March 2024 in which renewable generation was higher than that of fossil fuels. With the gap between the two during February 2025 significantly higher than in 2024, we think there's a very good chance that on April 1 we'll be able to report a repeat occurrence of the first ever "two months in a row" of 2024.
Wind
1686.9GWh of wind energy was about normal for this time of the year: yes, it was the third highest amount yet seen during a February month but a handful of large wind farms have come online in 2024; several cold, sunny days with low winds resulted in a relatively sober total.
However, we can report several notable events:
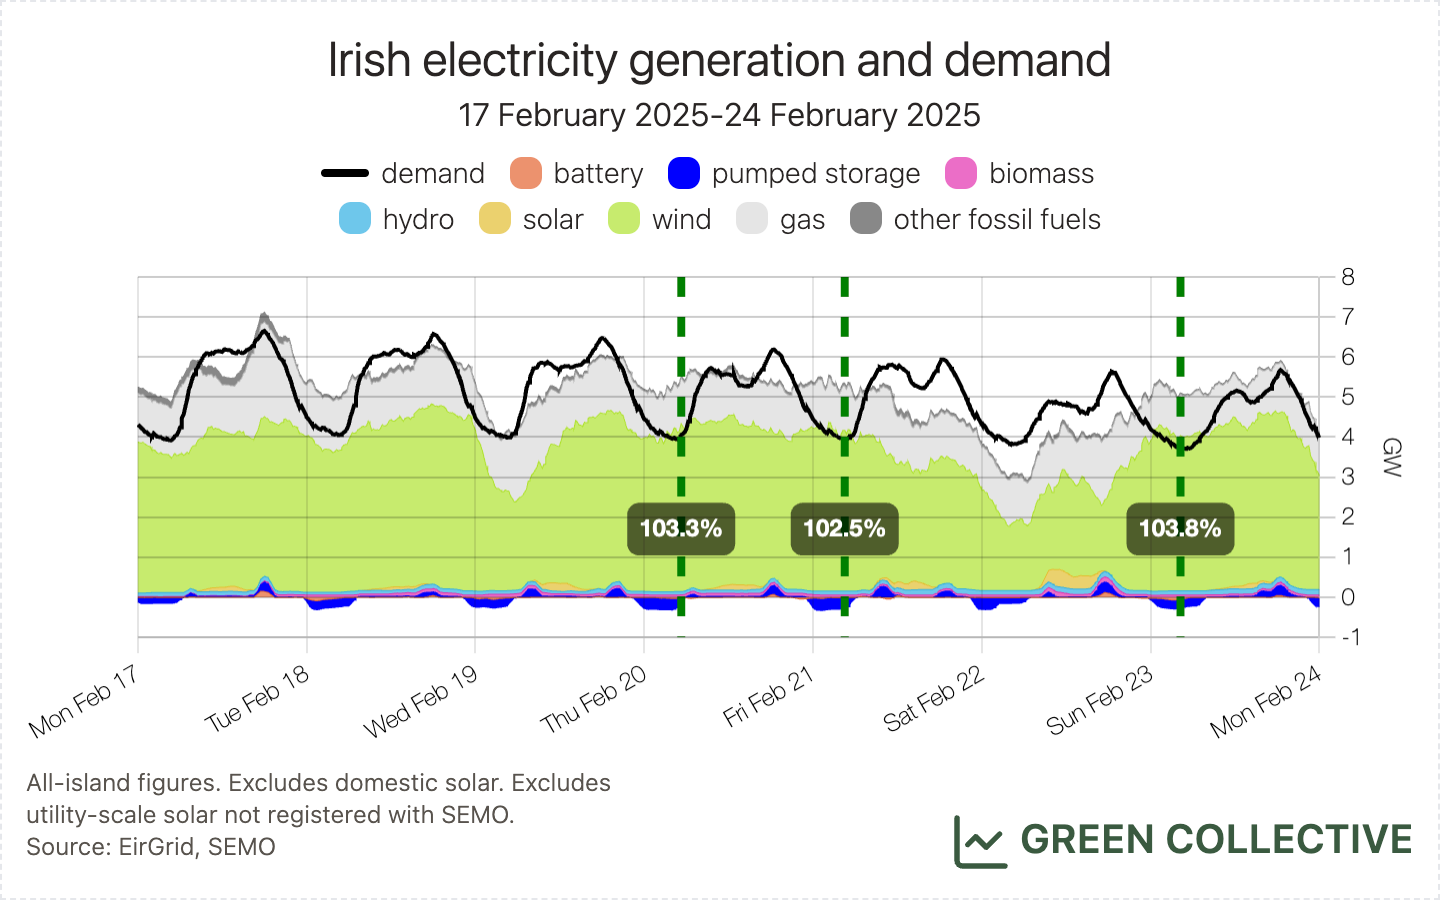
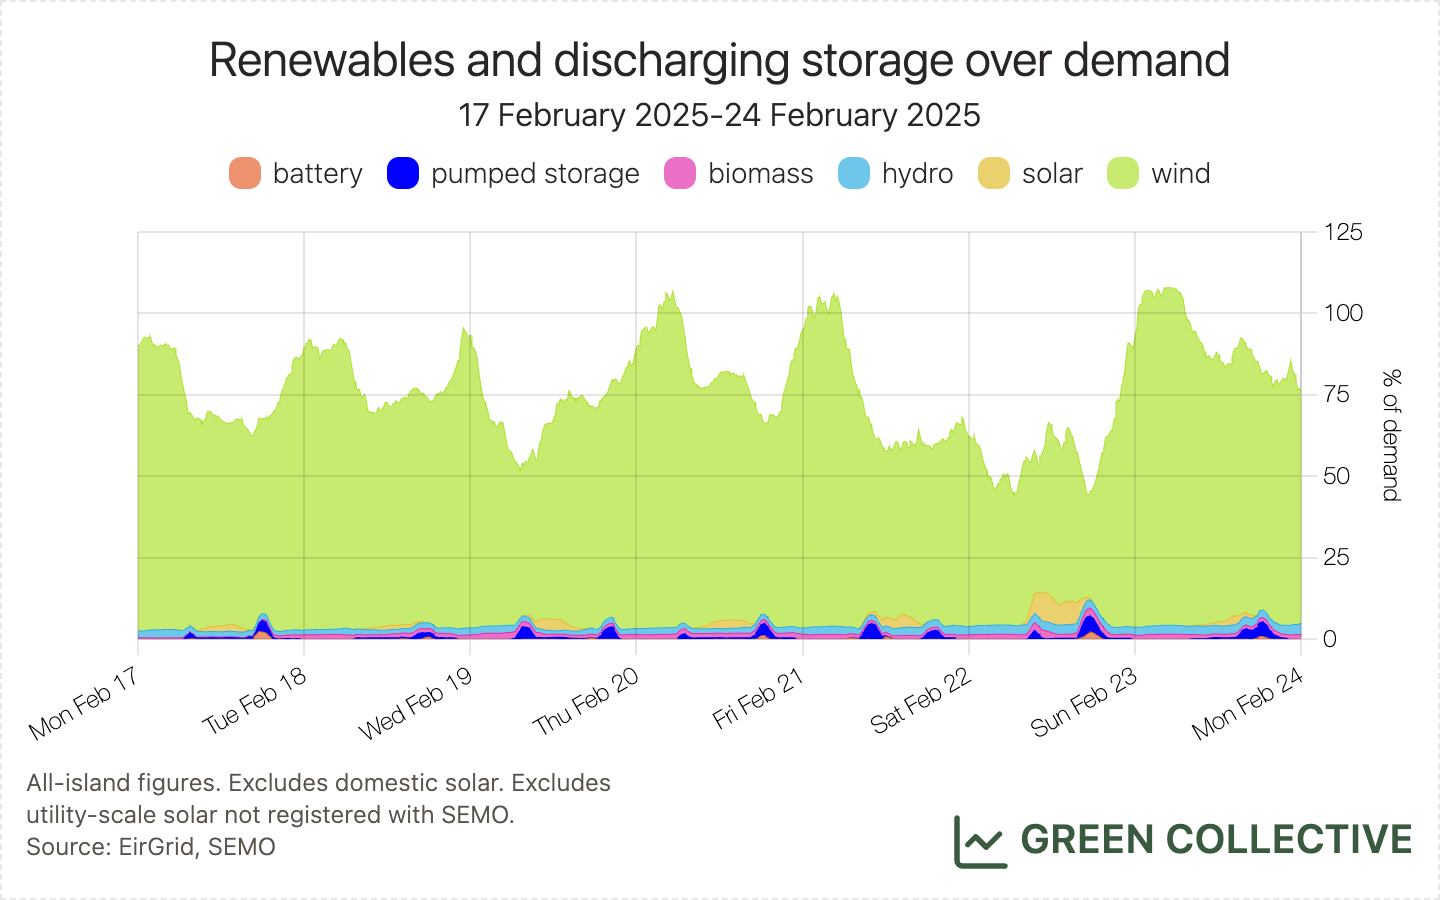
- Having occurred for the first (and, prior to February 2025, the only) time in September 2023, wind generation exceeded 100% of demand on no fewer than three mornings during February 2025. The last occurrence, on February 23, ran all the way from about 1am through 7am and it's the first time we have seen this occur more than momentarily and last beyond the wee small hours of the morning.
- A new wind output record of 3884MW was set in the Republic of Ireland on February 13, finally beating the previous record of 3846MW set December 6, 2023. Island-wide, wind generation on February 13 peaked at 4577MW: a figure exceeded on just three previous occasions.
- Renewable generation (along with discharging batteries and pumped storage) remained at >50% of demand for a full five days straight, Monday-Friday February 17-21. We haven't seen a streak like that since February 2021. For the week of February 17-24 as a whole, renewable generation was equivalent to 74.6% of demand: this was several percentage points ahead of any previous Monday-Sunday 7-day period.
Last month's top five wind-producing counties:
- Kerry: 200GWh
- Cork: 185GWh
- Mayo: 121GWh
- Offaly: 118GWh
- Galway: 113GWh
As usual, Cork and Kerry - the clear wind energy leaders - jostled for #1 position. Offaly, a recent entrant to the top five, remains strong but Mayo just took #3 position this month.
Solar
42.6GWh of solar energy was equivalent to approximately 1.2% of the month's demand. That's hardly a headline figure but, with the rate of growth in solar farm capacity we've seen in recent months, it will only be year or two before solar is more significant on the grid than hydro, even in winter months.
More significant is what solar can provide at the sun's peak around noon. In January, we saw daily peaks returning to levels comparable to last summer and we're happy to report that this trend continued in February: by the end of the month, solar peaks were exceeding 700MW. This is equivalent to just over 12% of mid-day winter demand; far more than hydro and biomass together and, on the calmest days, more than wind.
With the all-time record currently at 719MW, last month's prediction that we will see a new solar output record before the summer looks increasingly likely.
Last month's top three solar-producing counties:
- Meath (16GWh)
- Wexford (8GWh)
- Cork (5GWh)
Fossil Fuels and CO₂ Emissions
Fossil fuel generation during February 2025 was equivalent to 38.3% of all-island electricity demand:
- 35.3% gas
- 1.7% coal
- 1.2% waste-to-energy
- 0.2% oil
1338.3GWh was the lowest amount of energy from fossil fuel sources in a single month (in modern times). This was equivalent to 38.3% of demand, the lowest ever share for fossil fuels on the Irish grid.
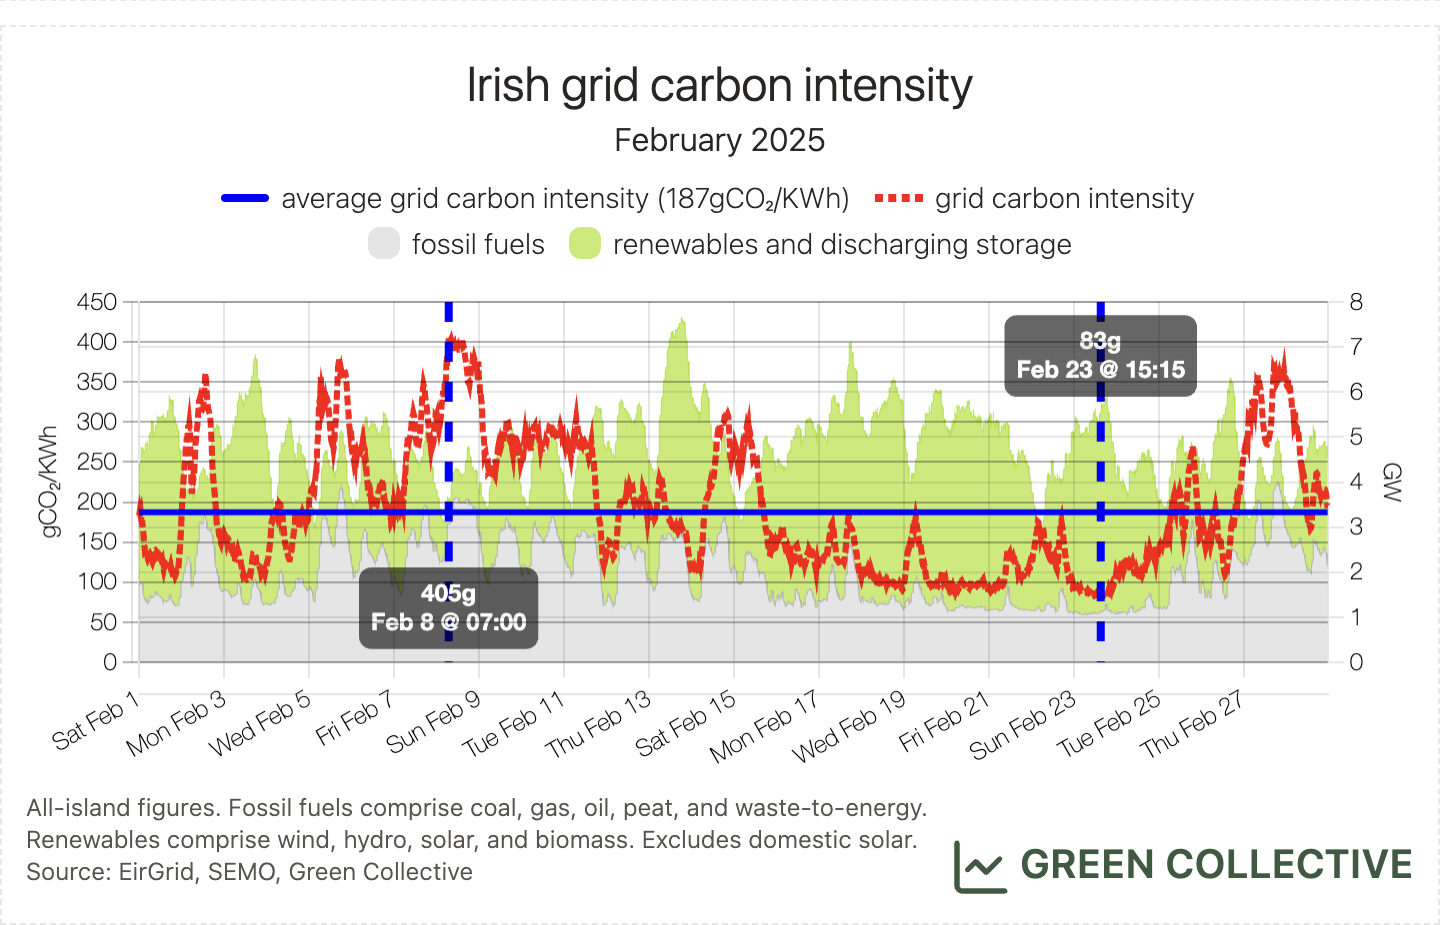
We estimate that for each kWh of electricity generated during February 2025 the Irish grid emitted between between 83g and 405g of CO₂, for an average of 187gCO₂/kWh. This was the lowest ever monthly grid carbon intensity for the Irish grid and the first time a whole month has averaged under 200gCO₂/kWh.
This smashes the previous record of 208gCO₂/kWh set in March 2024 by more than 10%. Additionally, the peak value of 405gCO₂/kWh was the lowest ever monthly peak value and the approximately 602,000 tonnes of CO2 was the lowest amount ever emitted in a single month.
In fact, we believe the only emissions-related record that wasn't broken during February 2025 was its trough of 83gCO₂/kWh which was the second-lowest value ever observed, just pipped by November 2024's 82gCO₂/kWh.
Looking at the two jurisdictions separately for a moment, we see that Northern Ireland averaged a grid carbon intensity of 221gCO₂/kWh while the Republic of Ireland averaged 179gCO₂/kWh.
Imports/exports
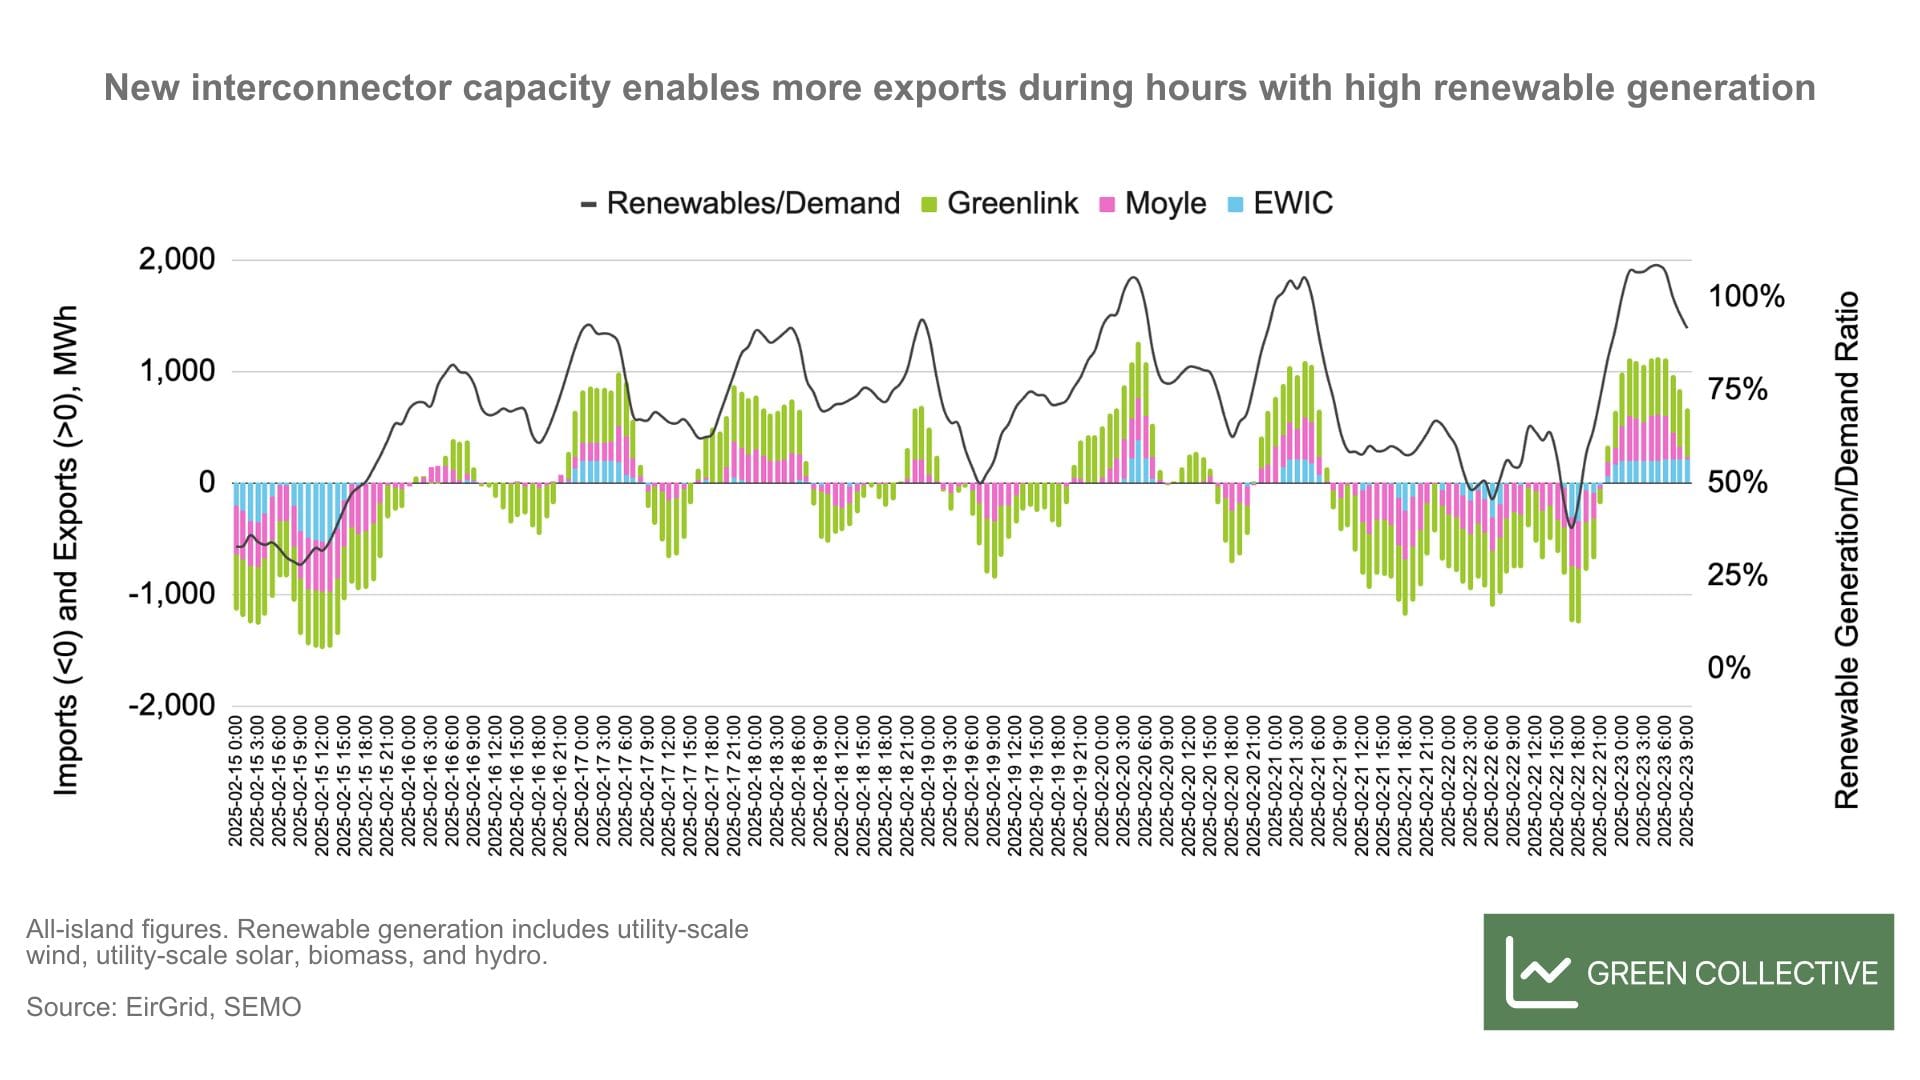
During February 2025, 400.9GWh (equivalent to 11.5% of demand) of electricity was imported into the grid while 125.8GWh (equivalent to 3.9% of generation) was exported to GB. Neither totals are unusual but the new Greenlink interconnector has led to new records:
- Imports exceeded 30GWh in one day for the first time on February 27. This was equivalent to just over 25% of the day's demand, also a record for the Irish grid.
- Seven of the top ten days ever for imports were in February 2025.
During the "golden week" with continuous high wind generation, as the chart below illustrates, it's clear that additional interconnection capacity from Greenlink helps Ireland export more electricity when renewable generation is extra high.
Hatches and Dispatches
While there were no new registered generators in February, we would like to shine a spotlight on the much-anticipated proposed decision paper on Large Energy Users from the Commission for Regulation of Utilities (CRU). Coverage of this publication has (rightfully) focused on the fact that the policy requires data centres to have onsite or proximate generation and/or storage. However, it doesn’t require explicit emissions reduction or offsetting measures, which will move Ireland away from achieving climate targets.
One detail in the paper caught our attention: the latency of fibre infrastructure and proximity to other data centres were cited as reasons why these large energy users are concentrated in and around Dublin. However, we are not sure if these are valid reasons. Access to undersea fibre-optic cables is not just available in Dublin, it also exists in the south and on the west coast. In fact, Apple had plans to build a data centre in County Galway ten years ago, but the plans were scrapped in 2018 after three years of planning approval delays. Theoretically, if you have to build data centres, wouldn’t it make more sense to put the additional load in regions that experience renewable dispatch down due to transmission constraints?
We are also not sure why data centres have to cluster. If you have any materials that would enlighten us on why there are not more data centres outside the Dublin/Meath cluster, we would love to hear from you at hello@greencollective.io. Thank you in advance for your time!