This article was first sent to our newsletter subscribers. To receive our monthly reports on the 1st of each month, subscribe now for free.
November 2024 was a month of Dunkelflaute: wind generation was well below normal for this time of the year, greatly impacting the overall amount of renewables on the grid. However, we've pored over the data and are happy to report a number of welcome highs and lows on the grid, particularly regarding batteries and grid carbon intensity.
Summary
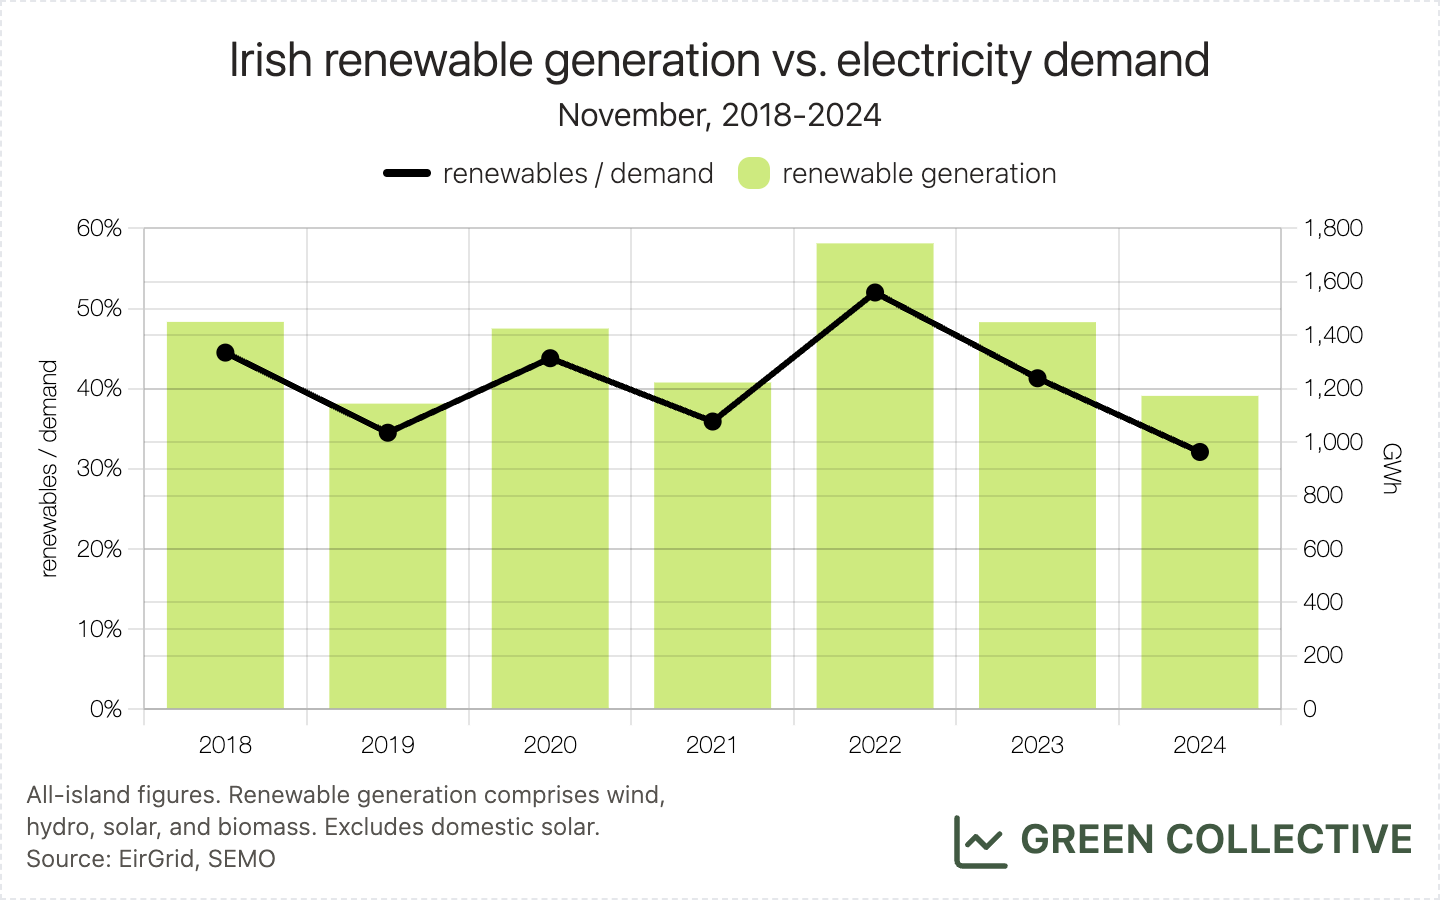
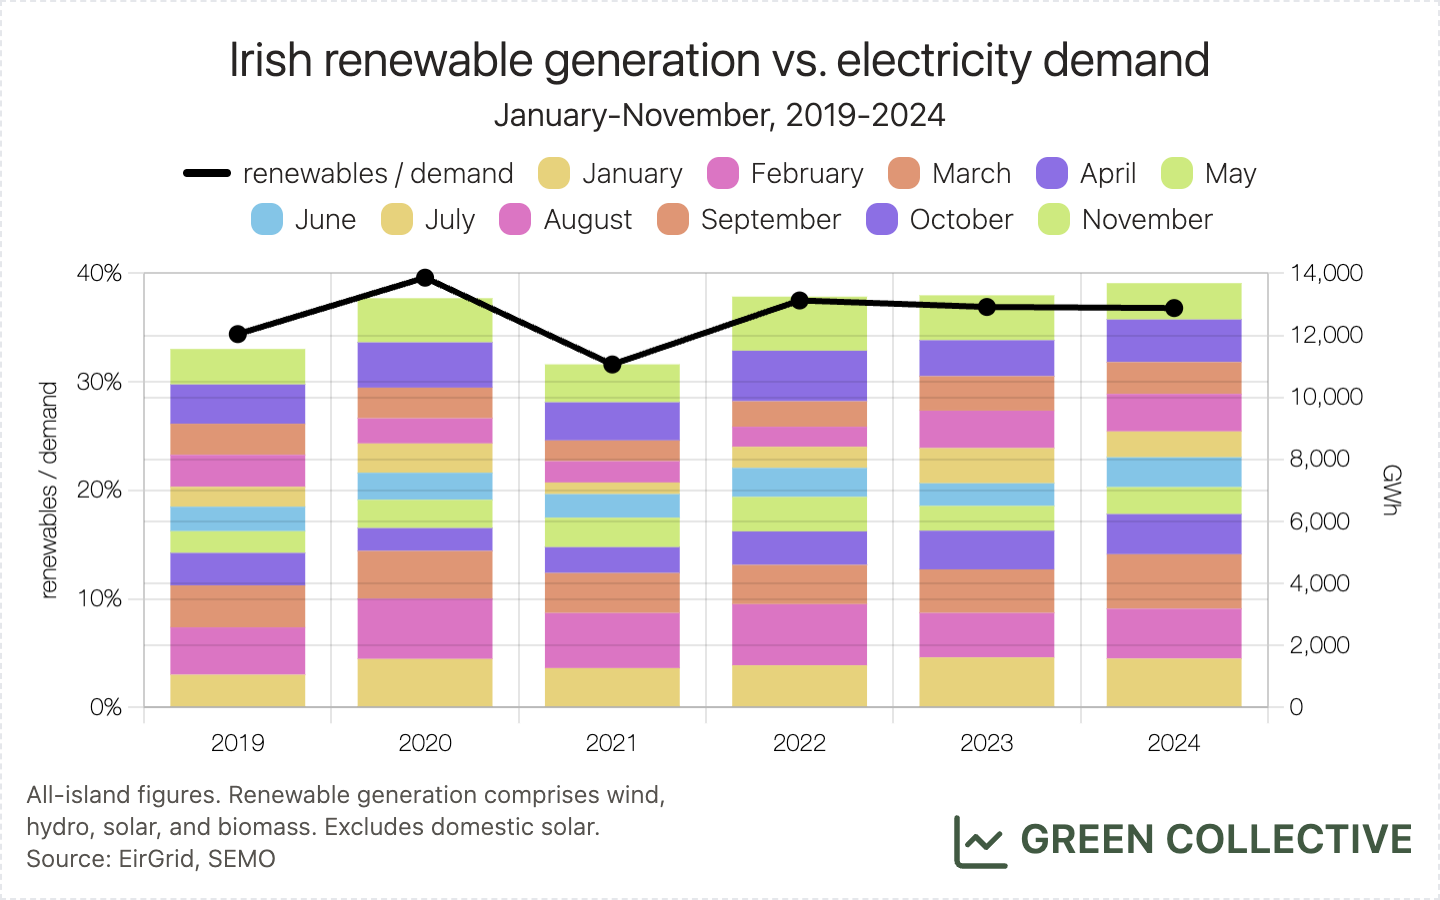
Generation from renewable sources during November 2024 was equivalent to 32.1% of all-island electricity demand:
- 28.5% wind
- 1.5% biomass
- 1.3% hydro
- 0.7% solar
This was the lowest proportion of electricity demand met by renewables during any November month for which we have data (that's 2018 onwards). In terms of generation, 1173GWh was the second-lowest amount of electricity generated from renewables that we have seen during a November month, just beating November 2019's 1144GWh.
Renewable generation has now been equivalent to 36.8% of all-island electricity demand during the first 11 months of the year.
Last month, we predicted that 2024 will likely finish as the year with the most ever renewable generation unless both November and December saw unusually low renewable generation. With November now having seen unusually low renewable generation, December 2024 will need approximately 1.5TWh for 2024 to finish with this record; this is possible - December 2023 neared 2TWh - but it seems unlikely that 2024 will also finish with the renewables/demand record.
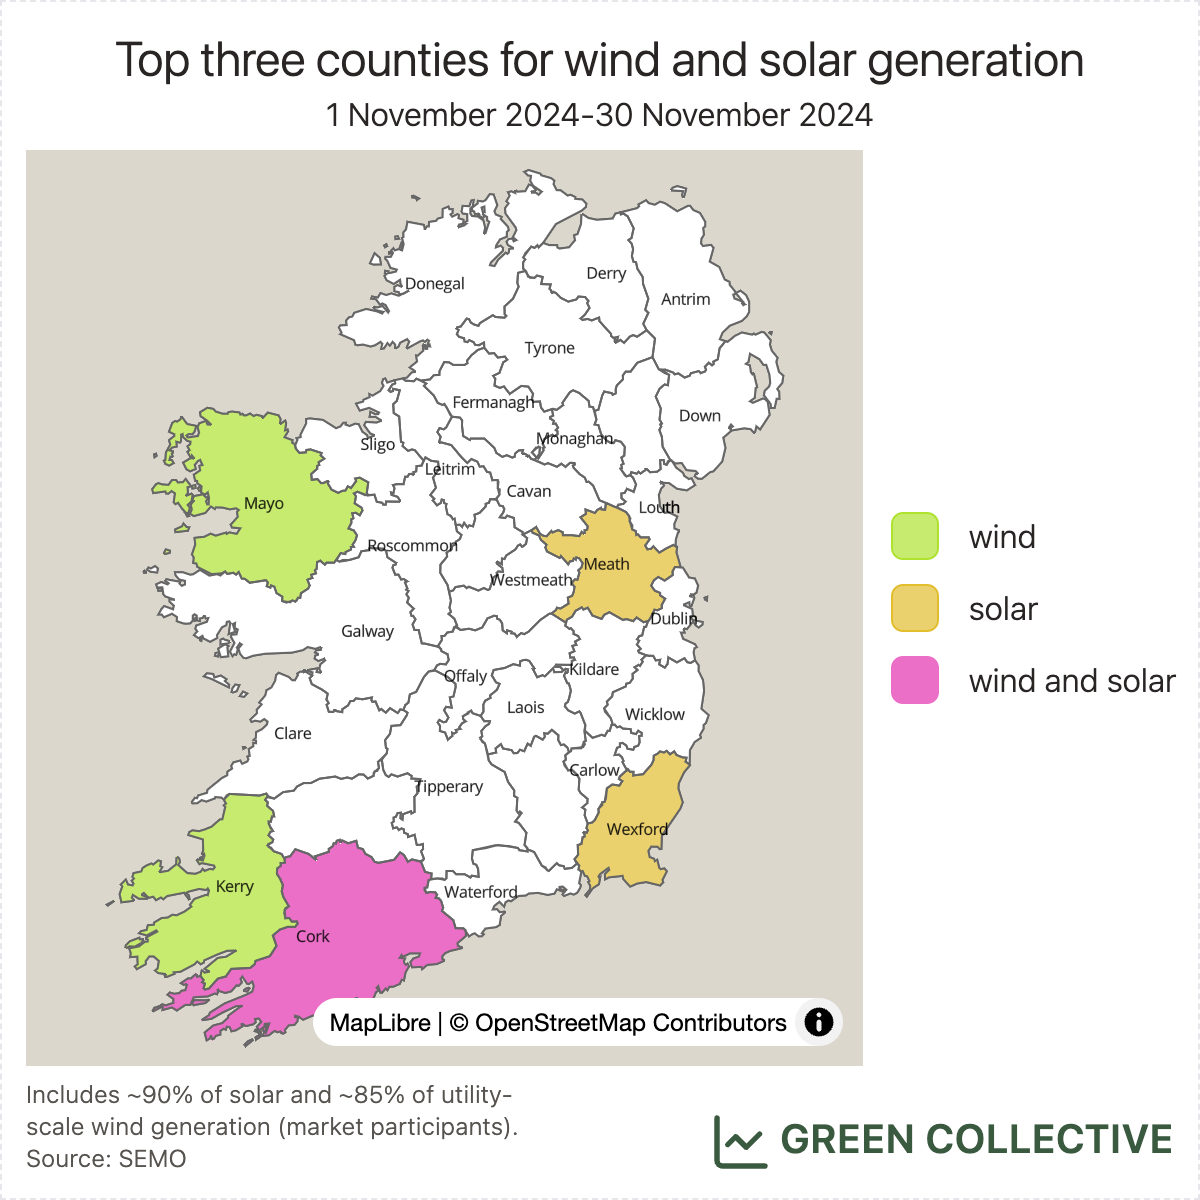
Top counties for wind and solar
Wind:
- Kerry
- Cork
- Mayo
Solar:
- Meath
- Wexford
- Cork
Wind
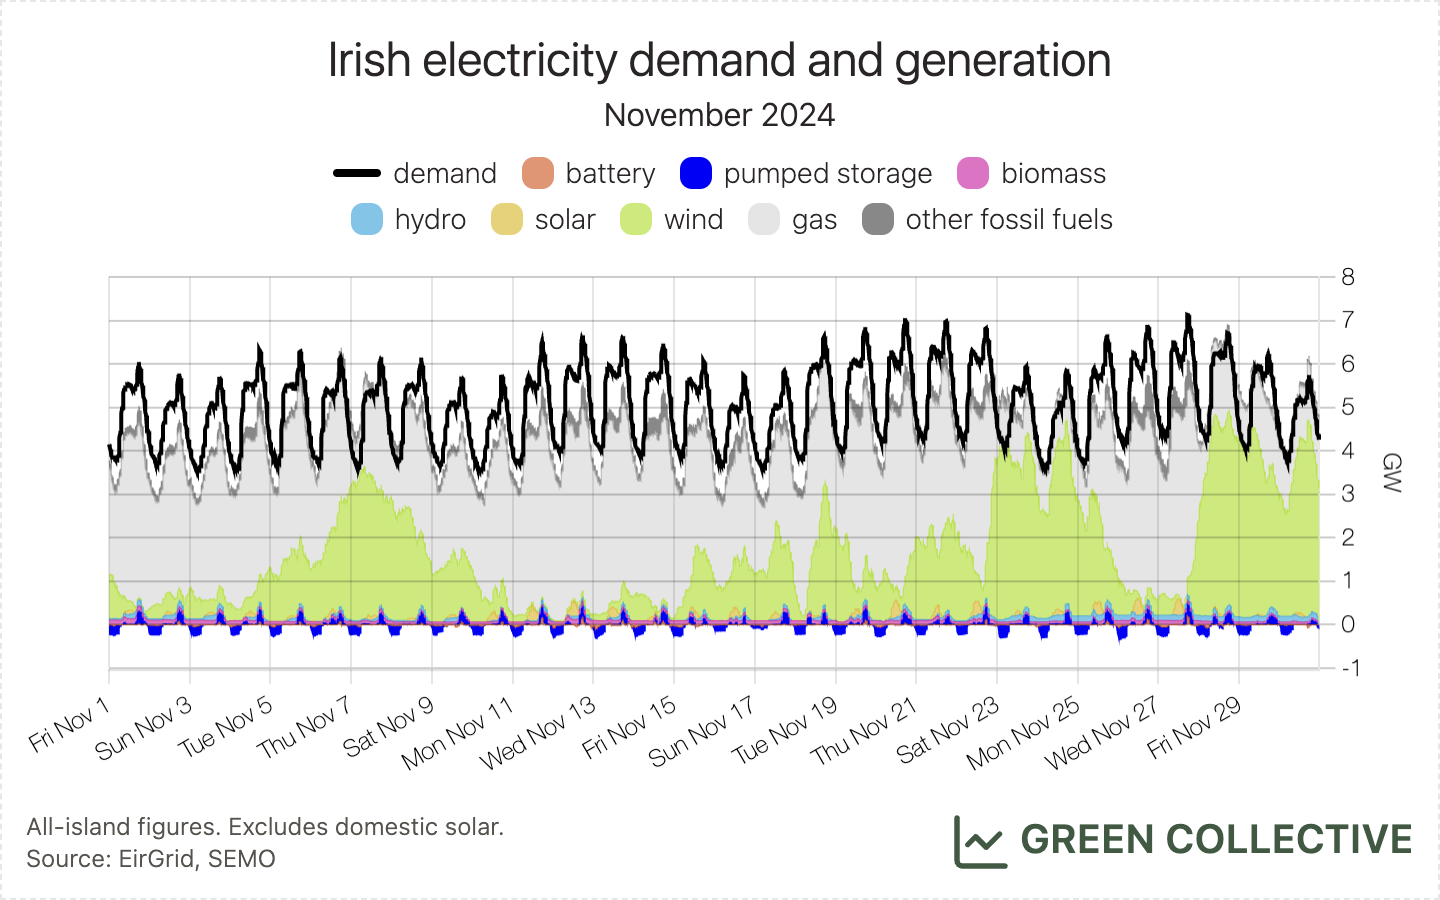
With several Dunkelflaute periods during November 2024, wind generation was unusually low for this time of year: 1043.3GWh was the lowest amount of electricity generated from wind during a November month since 2018 and its wind/demand ratio of 28.5% was the lowest for a November month since 2017.
However, there were some bright spots for wind generation:
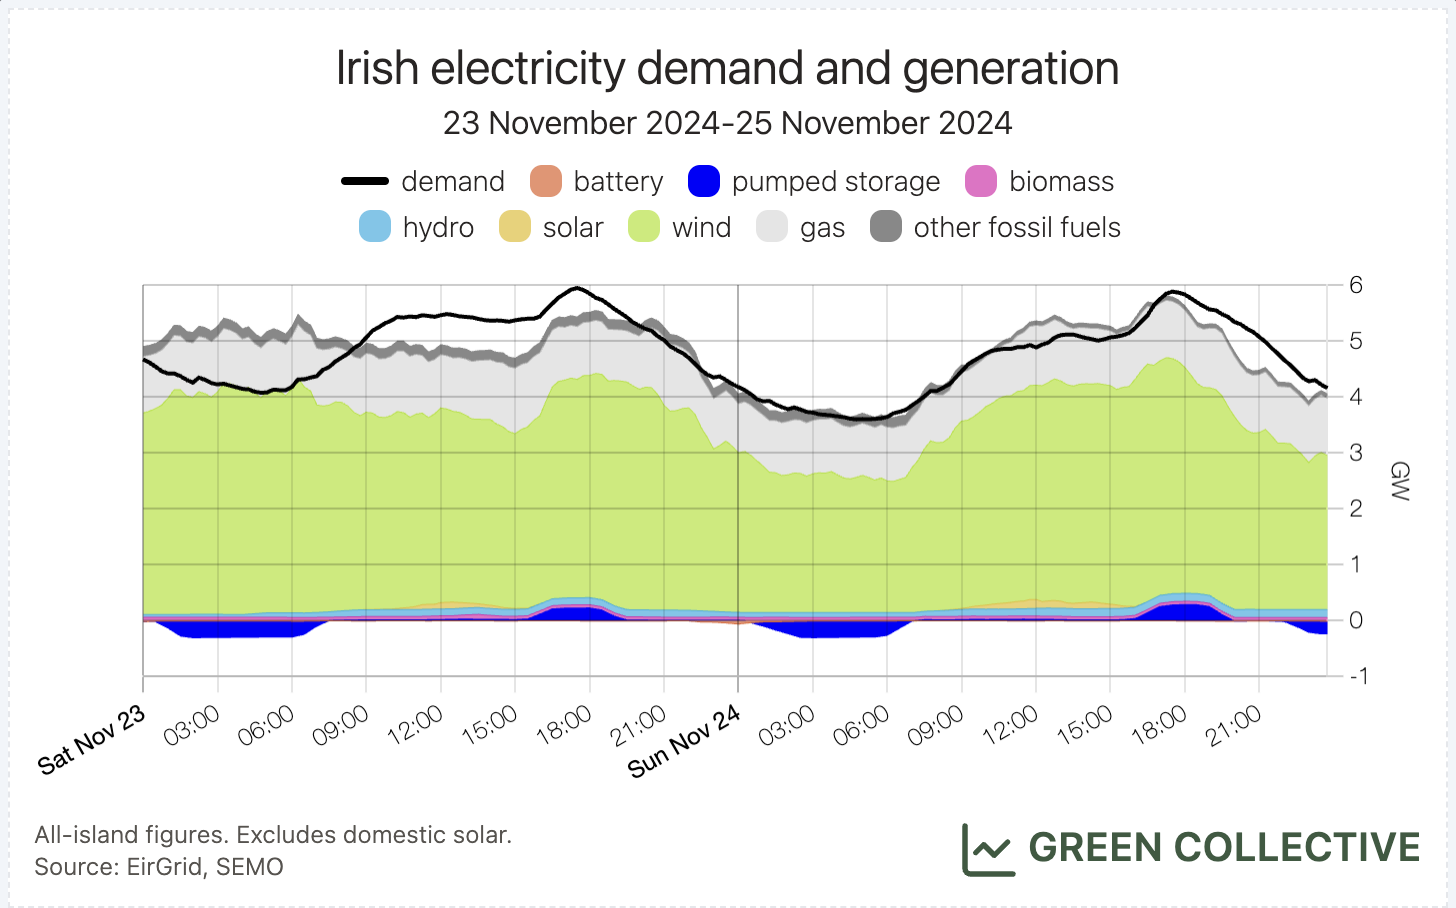
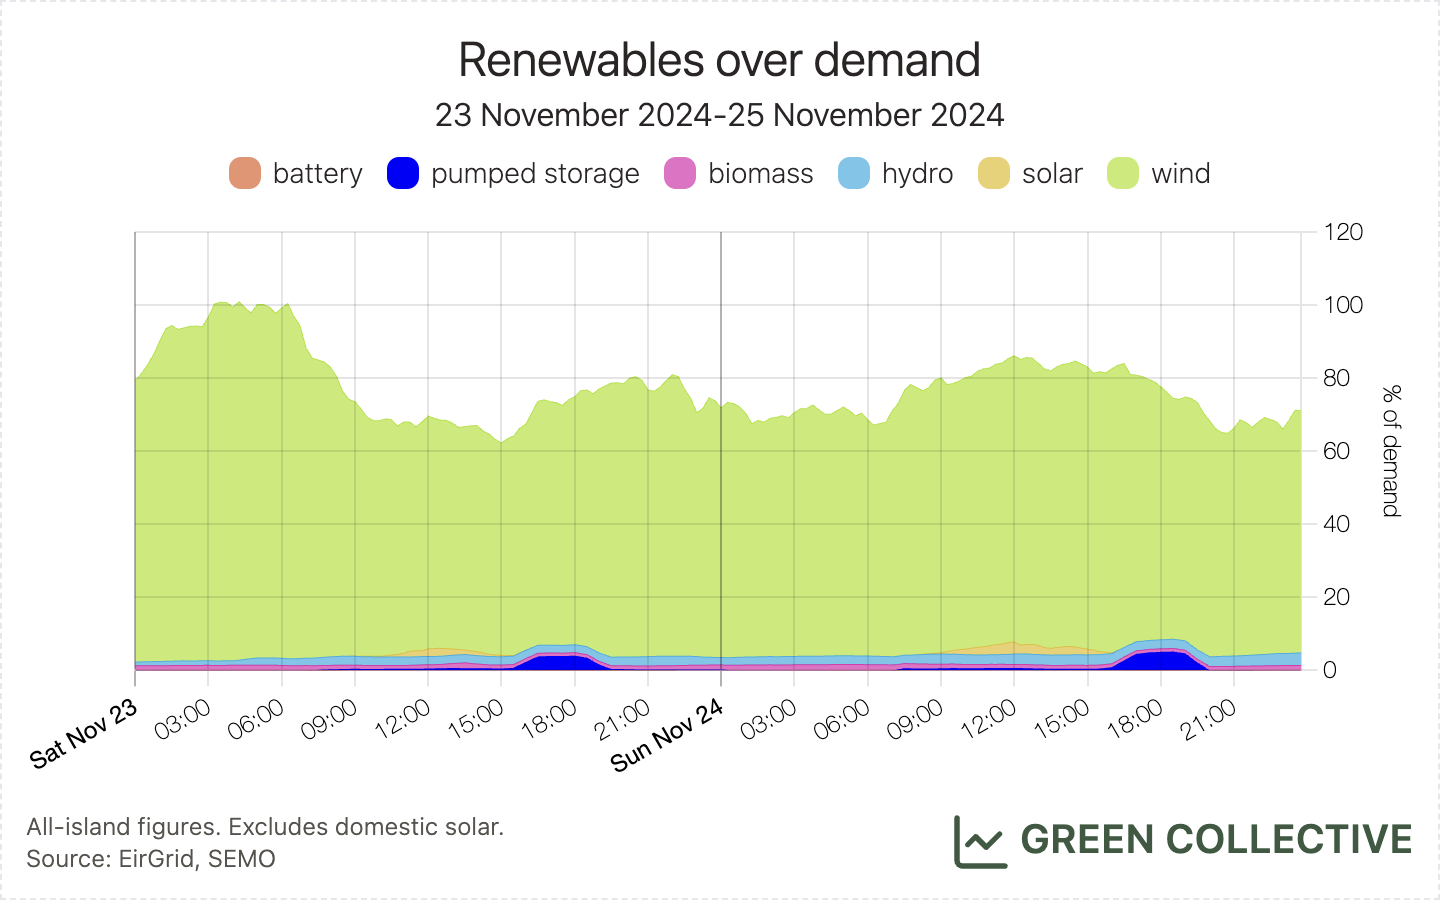
- Renewables met 76% of electricity demand during Storm Bert (Saturday and Sunday, November 23-24). This was the highest renewables/demand ratio for any weekend in almost two years. We saw three 80% weekends in 2022 but rising demand since prevented a re-occurrence.
- We saw 4528MW of wind output on November 30. This was a new high for a November month and, in fact, the ninth-highest ever wind output seen on the Irish grid.
Solar
While even during October we were still seeing daily peaks within striking distance of the summer's highs, winter has definitely hit and peak solar output during November was 415MW on November 20, just over half that of the peaks of summer.
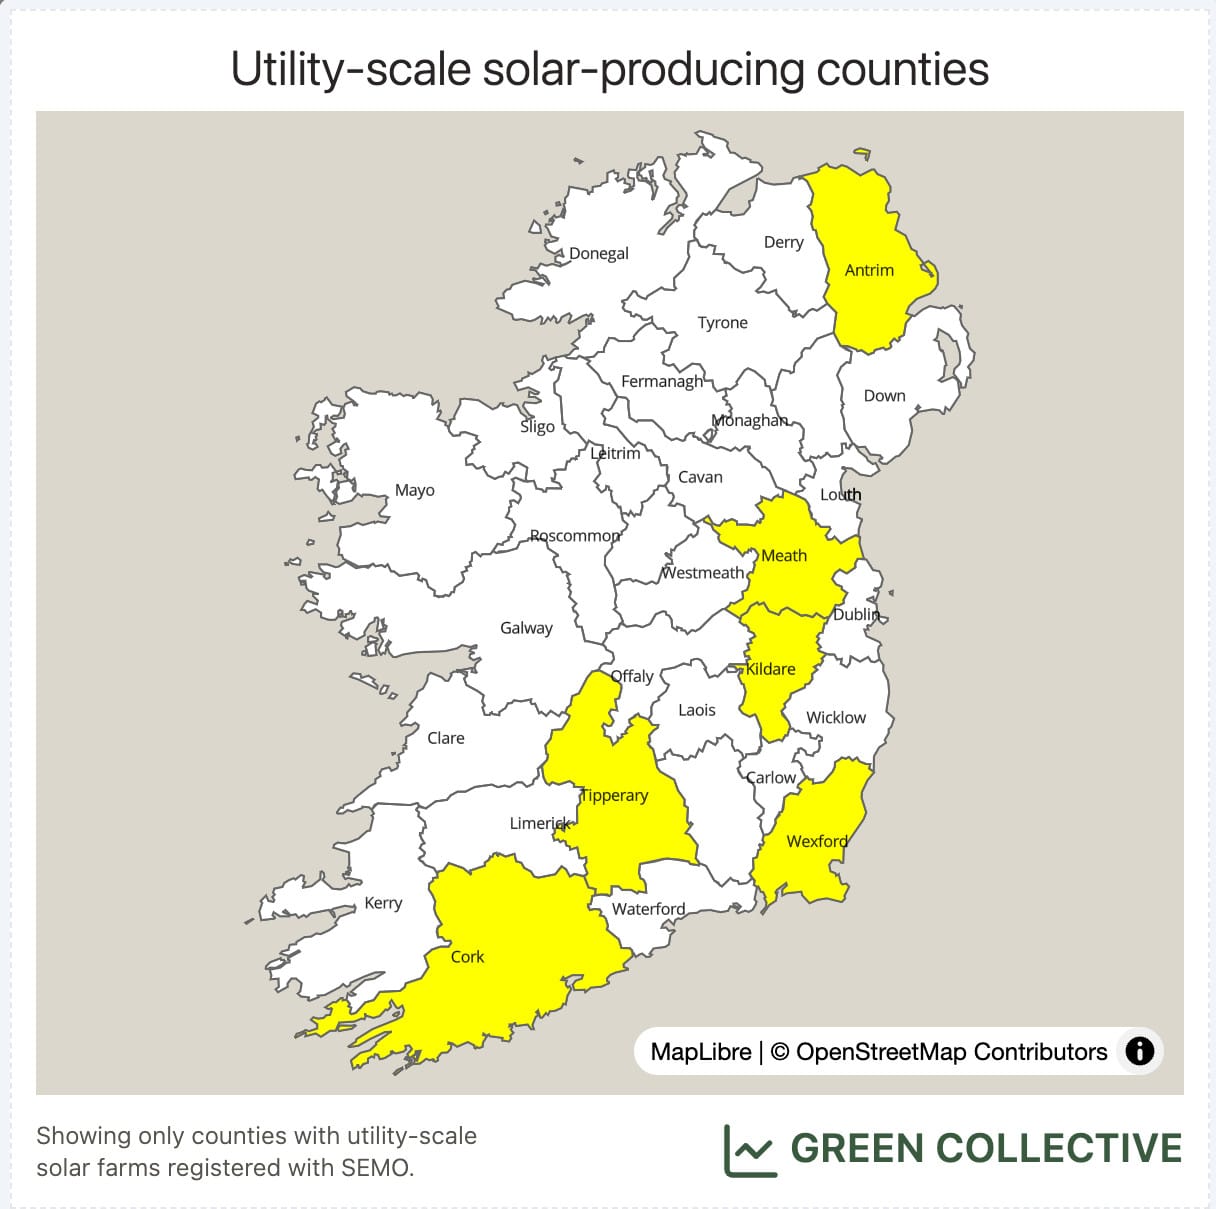
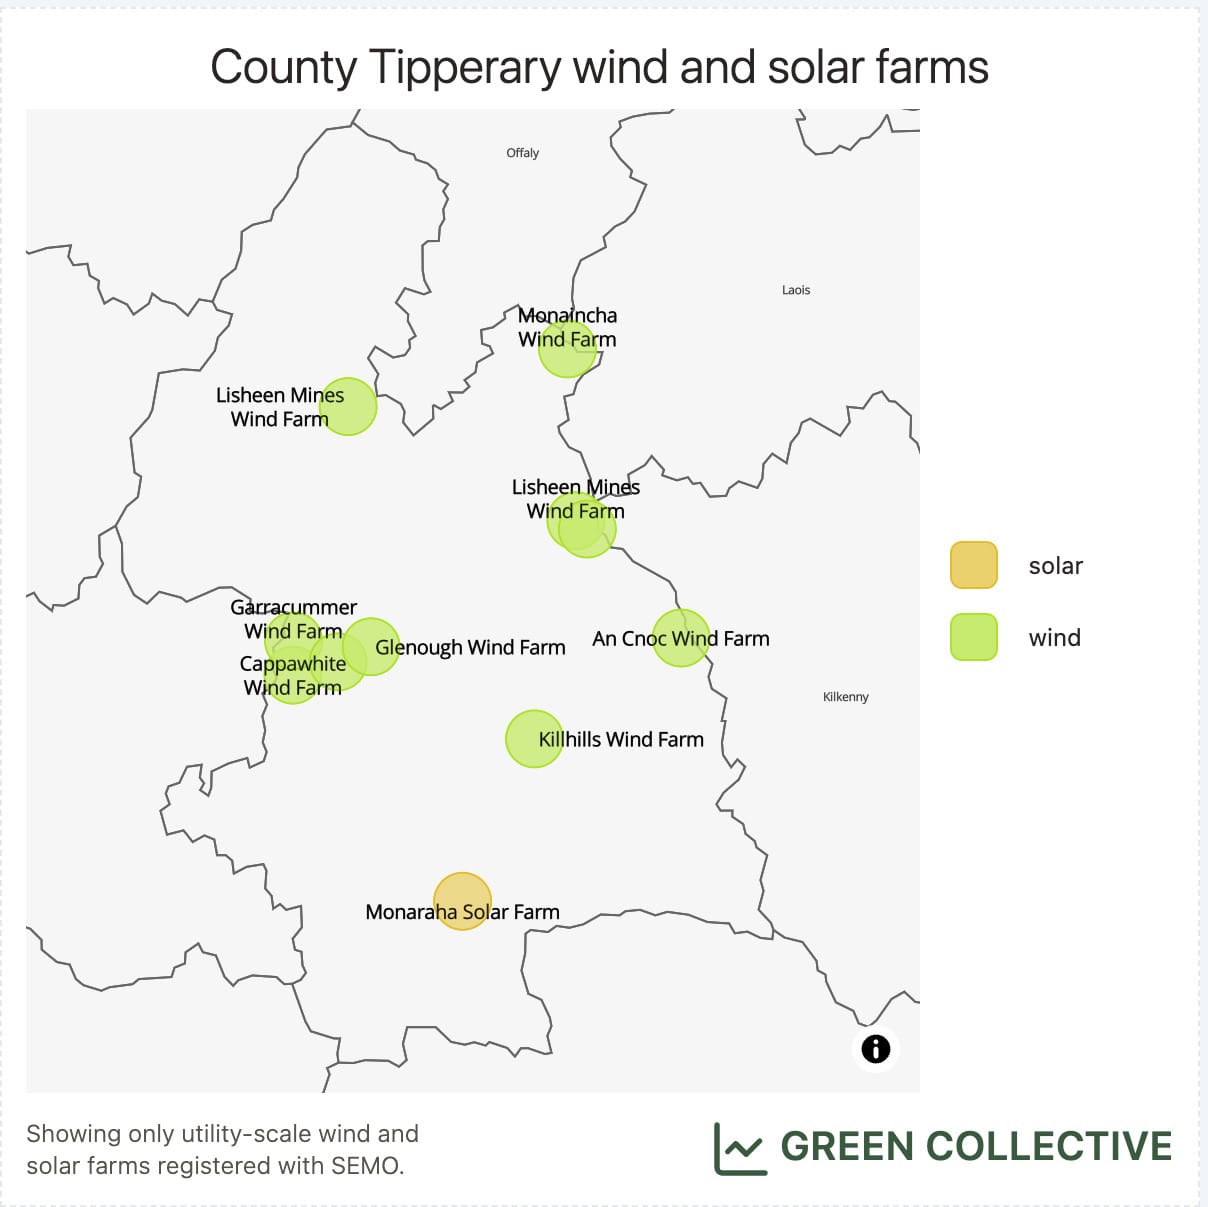
However, solar continues to grow faster than any other source on the Irish grid. For the second month in a row, we saw a new solar farm appear on the grid: Monaraha (also known as Ballymacadam), with a maximum export capacity expected to reach 21MW. This is Tipperary's first large-scale solar farm.
Fossil fuels
Fossil fuel generation during November 2024 was equivalent to 56.4% of electricity demand. This was significantly higher than November 2023's 48.6% and is a return to the 2TWh+ figures not seen during a November month since 2021.
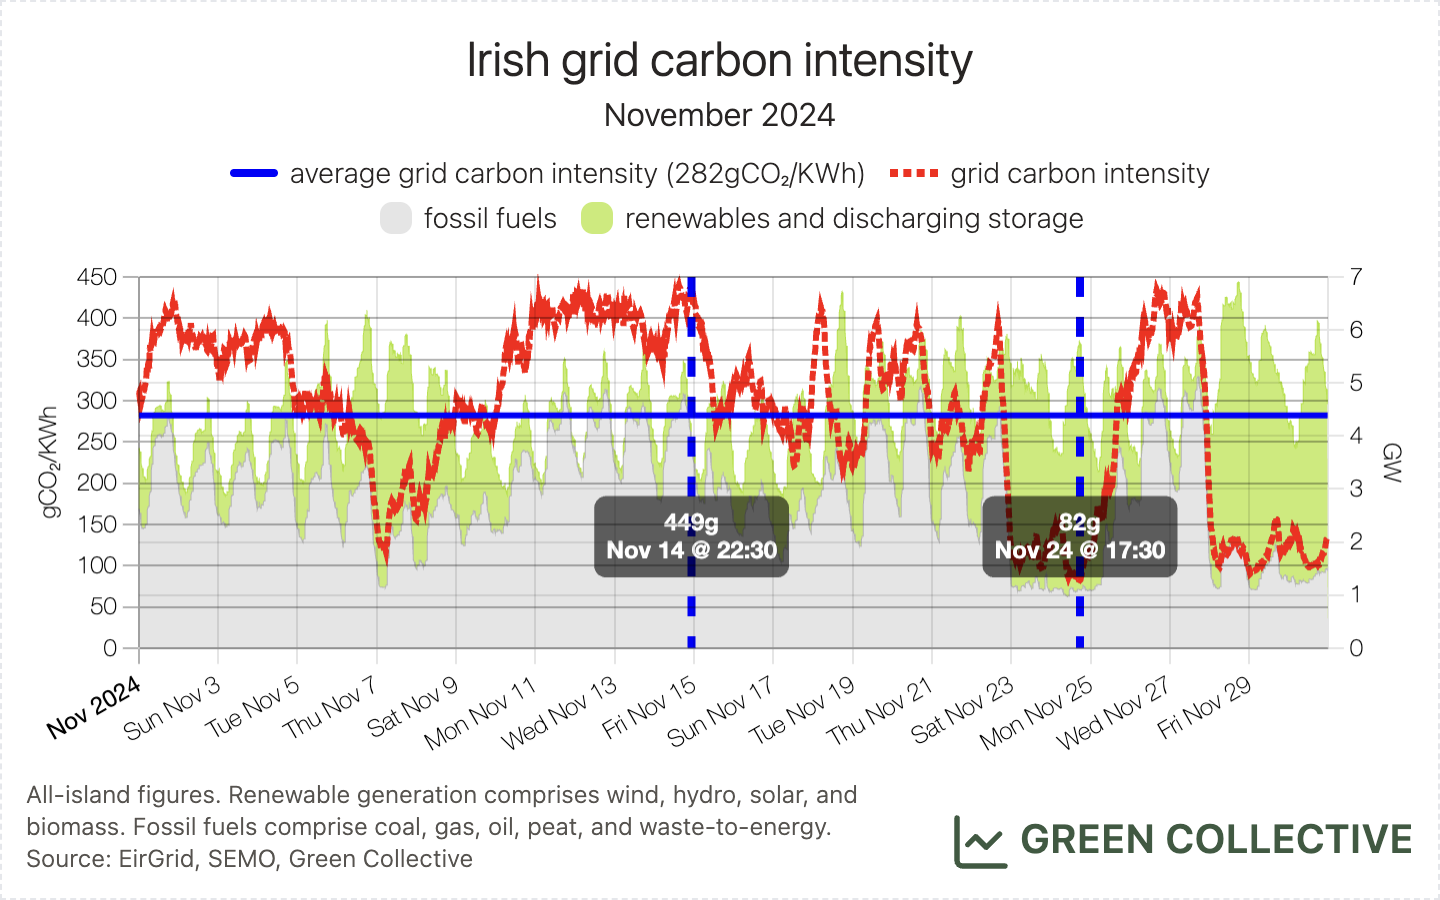
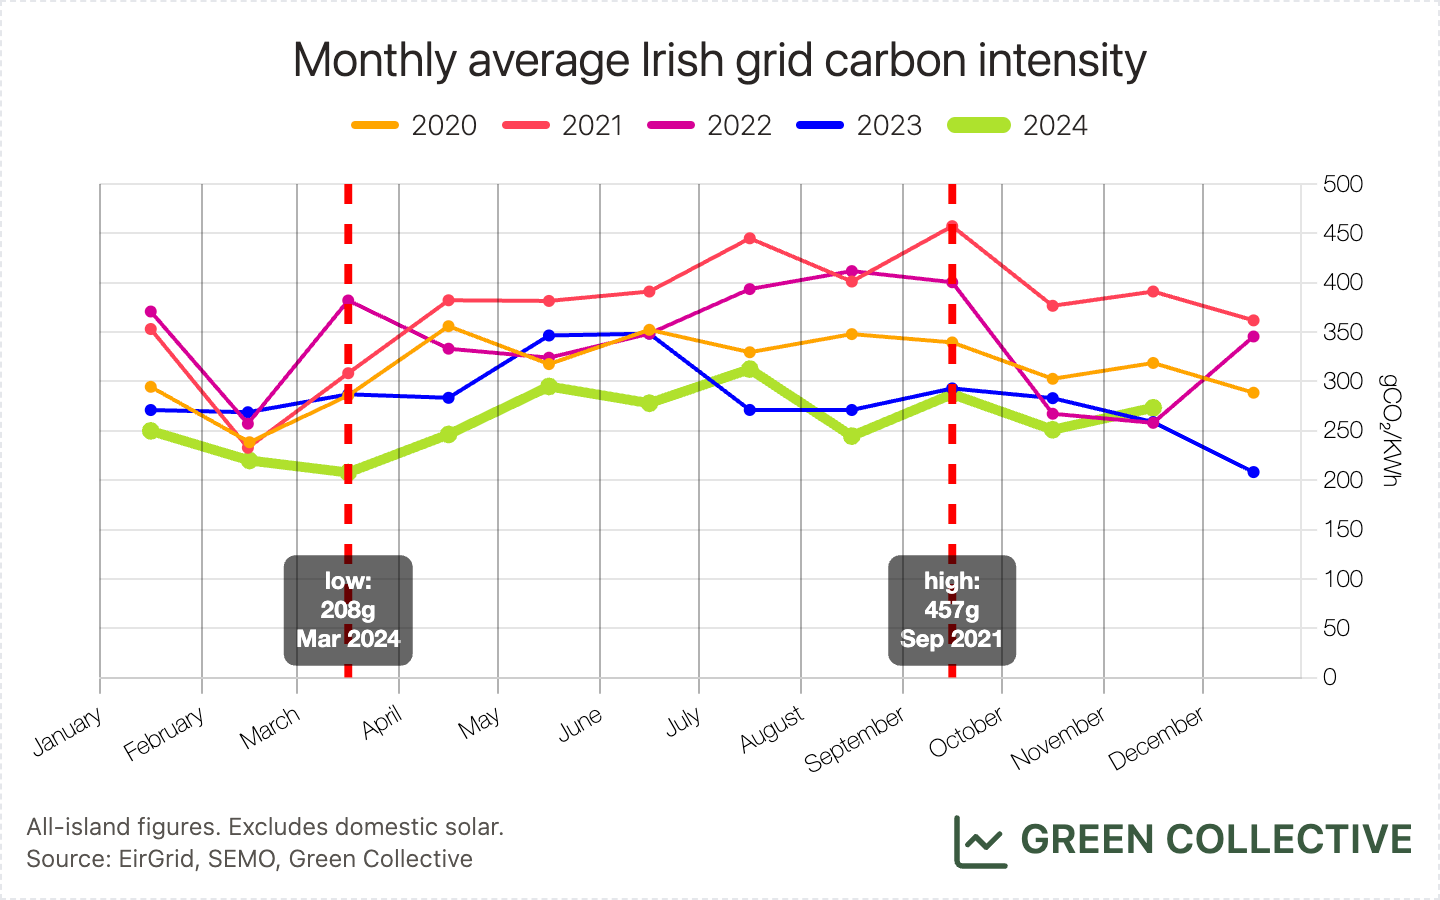
We estimate that for each kWh of electricity generated during November 2024 the Irish grid emitted between between 82g and 449g of CO₂, for an average of 281gCO₂/kWh. While this was unfortunately only the second month so far this year (along with July) not to have the lowest ever average grid carbon intensity for that month of the year, 82g was a new all-time low for grid carbon intensity on the Irish grid.
We can attribute this welcome new low to several factors:
- high winds from Storm Bert
- higher winter demand
- no coal plants were active at the time
With Moneypoint due to switch to last-resort oil generation at the end of 2024, we anticipate further emissions lows after Christmas.
Storage
The vast majority of revenue for battery energy storage system (BESS) assets in Ireland comes from the DS3 programme. Batteries availing themselves to provide ancillary services receive extra financial rewards when the share of wind and solar generation gets higher. This is known as the temporal scarcity scalar (TSS) used to determine payments to batteries. When more than 50% of generation is coming from inverter-based resources, the grid is more likely to require ancillary services from fast-acting technologies like batteries in order to keep the system stable, hence the higher reward.
In our last issue, we mentioned that market incentives had recently changed for BESS assets. Specifically, grid operators have lowered TSS since October 2024 which has led to decreased revenues from ancillary services. We took a closer look at asset-level revenue streams and compared our estimates between October 2023 and 2024. These two months had similar grid conditions and we have illustrated changes in revenue streams for two BESS assets (BESS A and BESS B) below. These batteries both have long-term capacity contracts and qualified for the same set of ancillary services under DS3, though they are quite different in capacity.
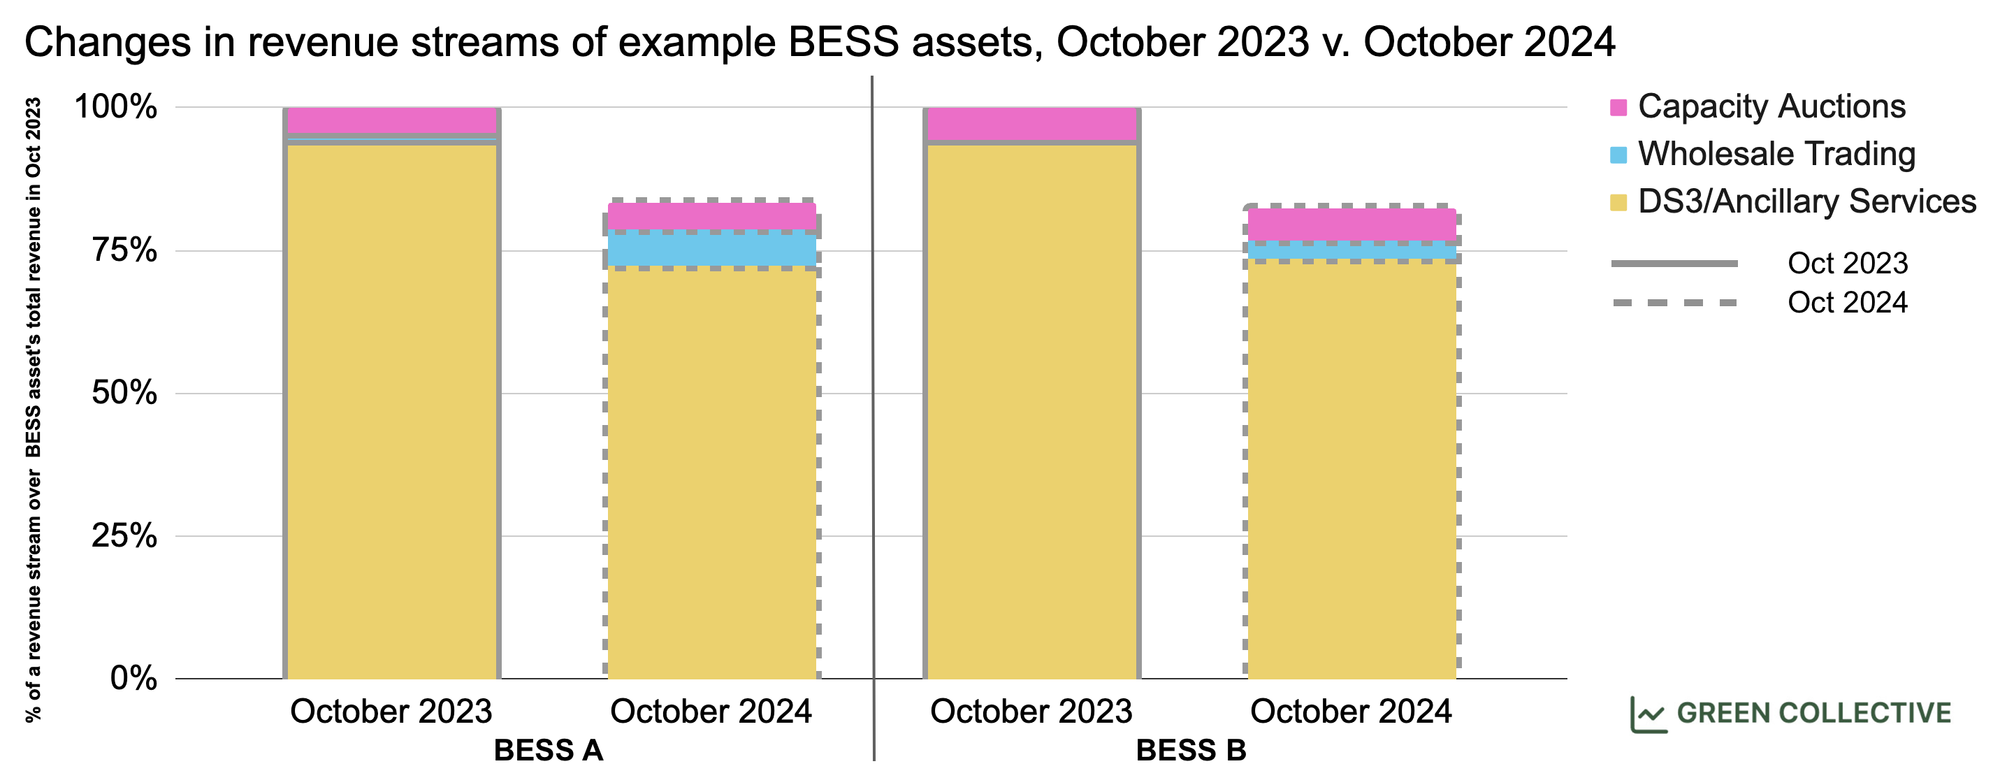
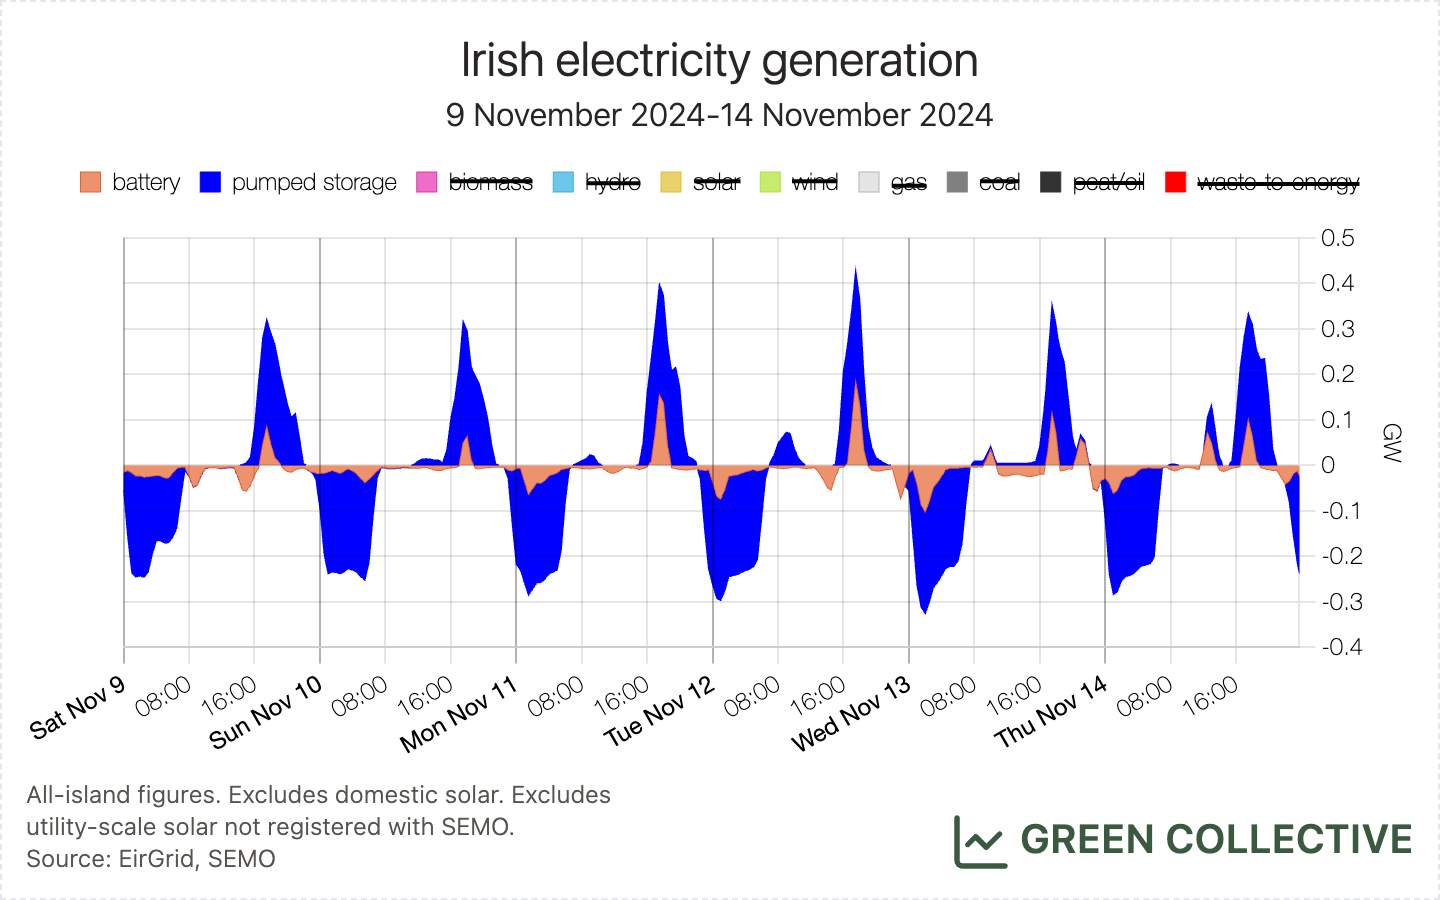
As shown on the chart above, after the lower TSS came into effect, BESS A and BESS B saw an apparent drop in DS3 revenue, by 22.3% and 22.1% respectively. Both assets had little to no whole trading activity in October 2023. However, in order to supplement lost revenue from ancillary services, both BESS A and BESS B increased trading activities, resulting in batteries discharging during peak hours when demand and wholesale prices are high. This is why we saw new battery discharge records in October. These changes to market incentives for battery owners were even more apparent during November and we are now regularly seeing batteries reach 150-200MW during low-wind periods.
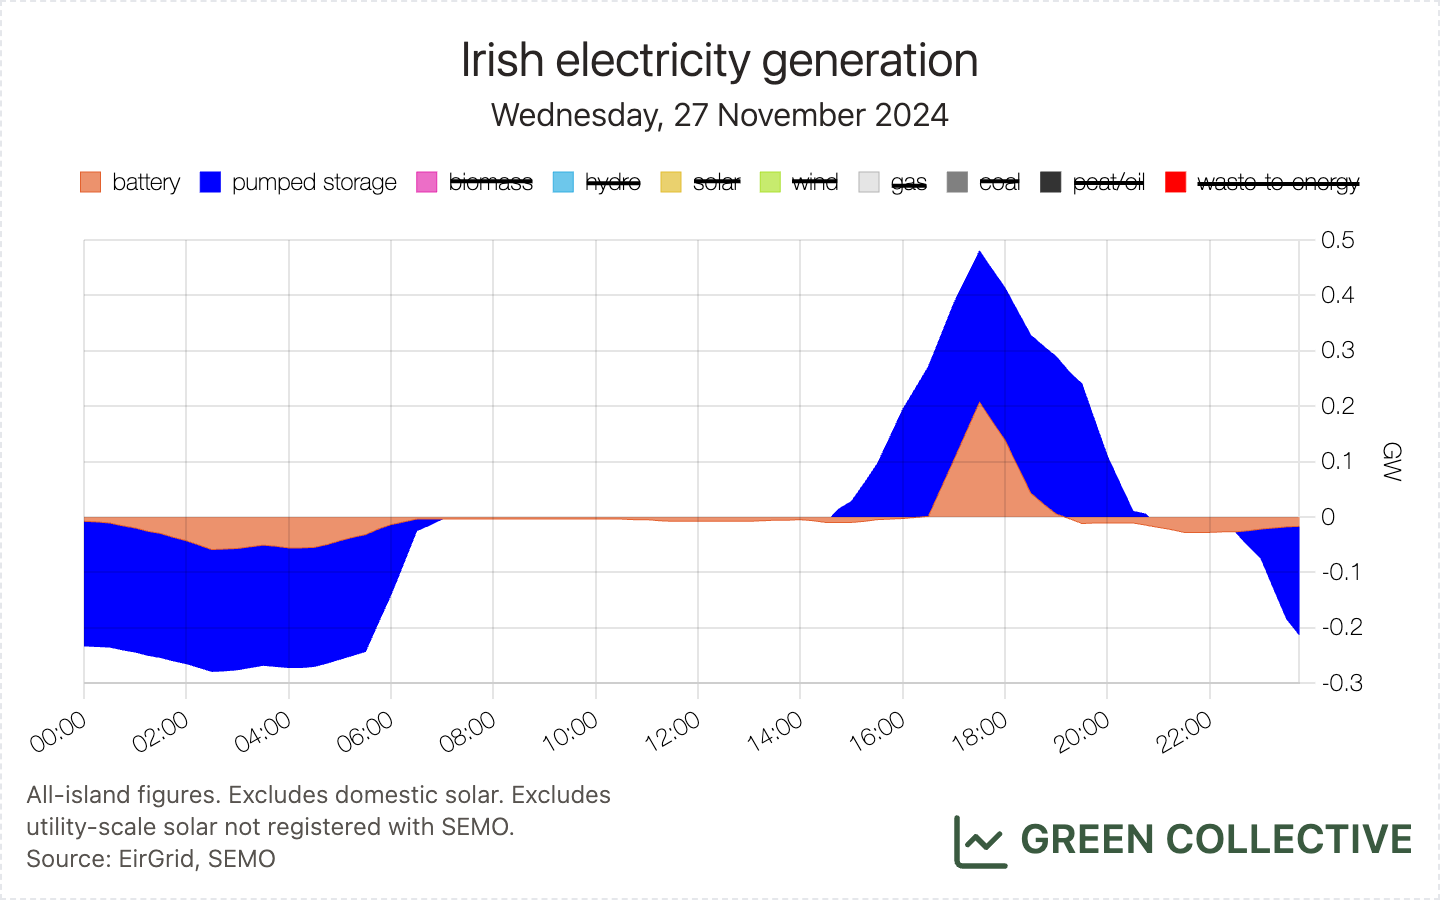
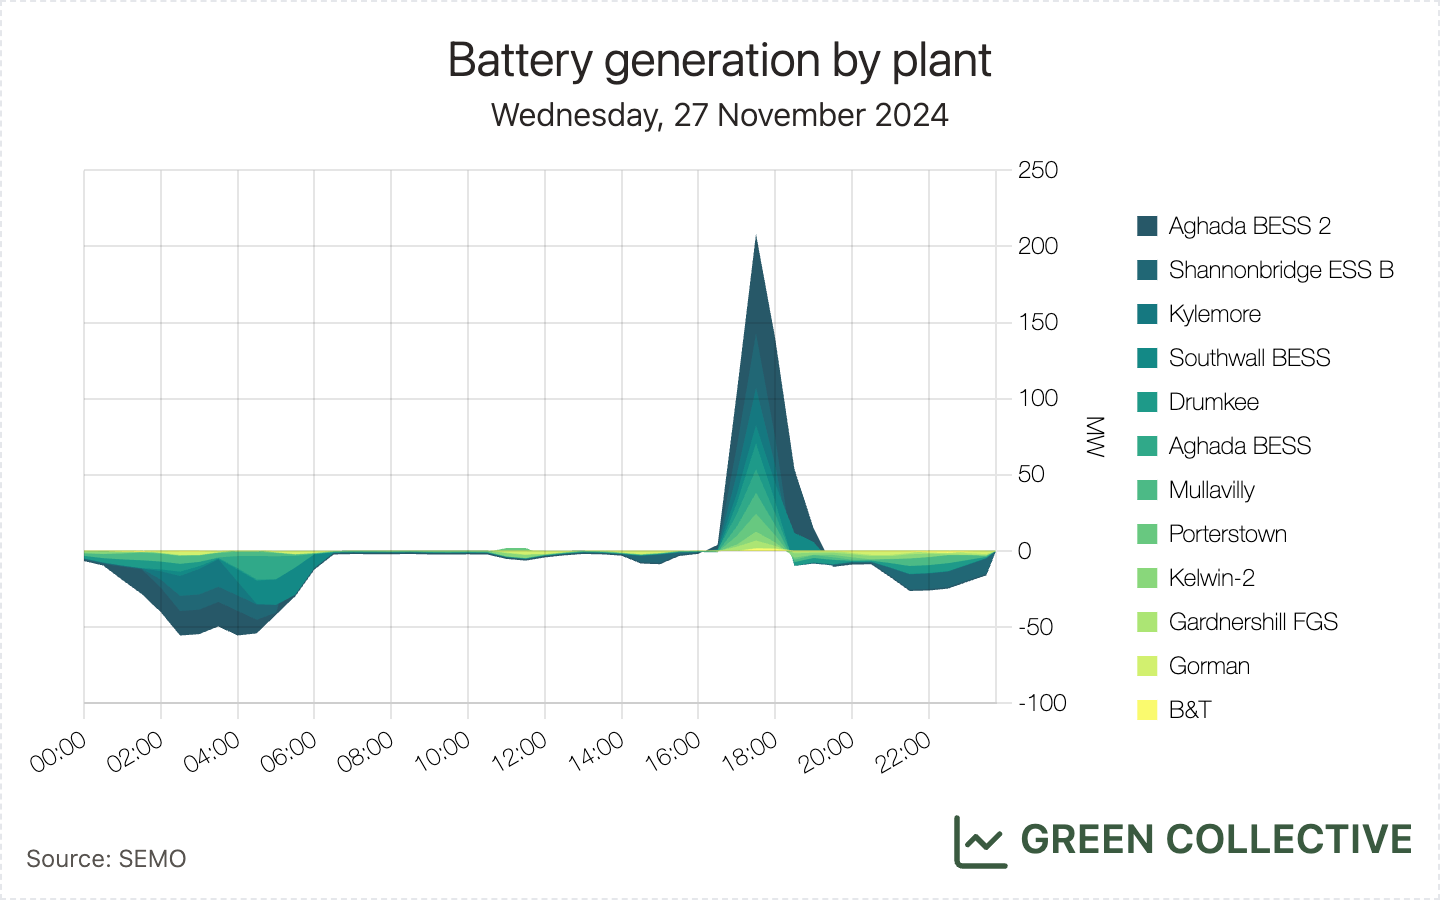
We want to highlight two new all-time highs reached November 27:
- battery discharge exceeded 200MW during peak load for the first time
- combined storage discharge (batteries along with Turlough Hill) reached 480MW
That peak of 480MW was equivalent to 6.7% of demand at the time; owing to the significantly higher winter weekday demand, this was well below the record 9.2% set during August.
We want to note also that even 200MW is well below the island's current battery capacity of approximately 800MW; to date, participating batteries were largely owned and/or optimised by ESB and Statkraft.
Everything else
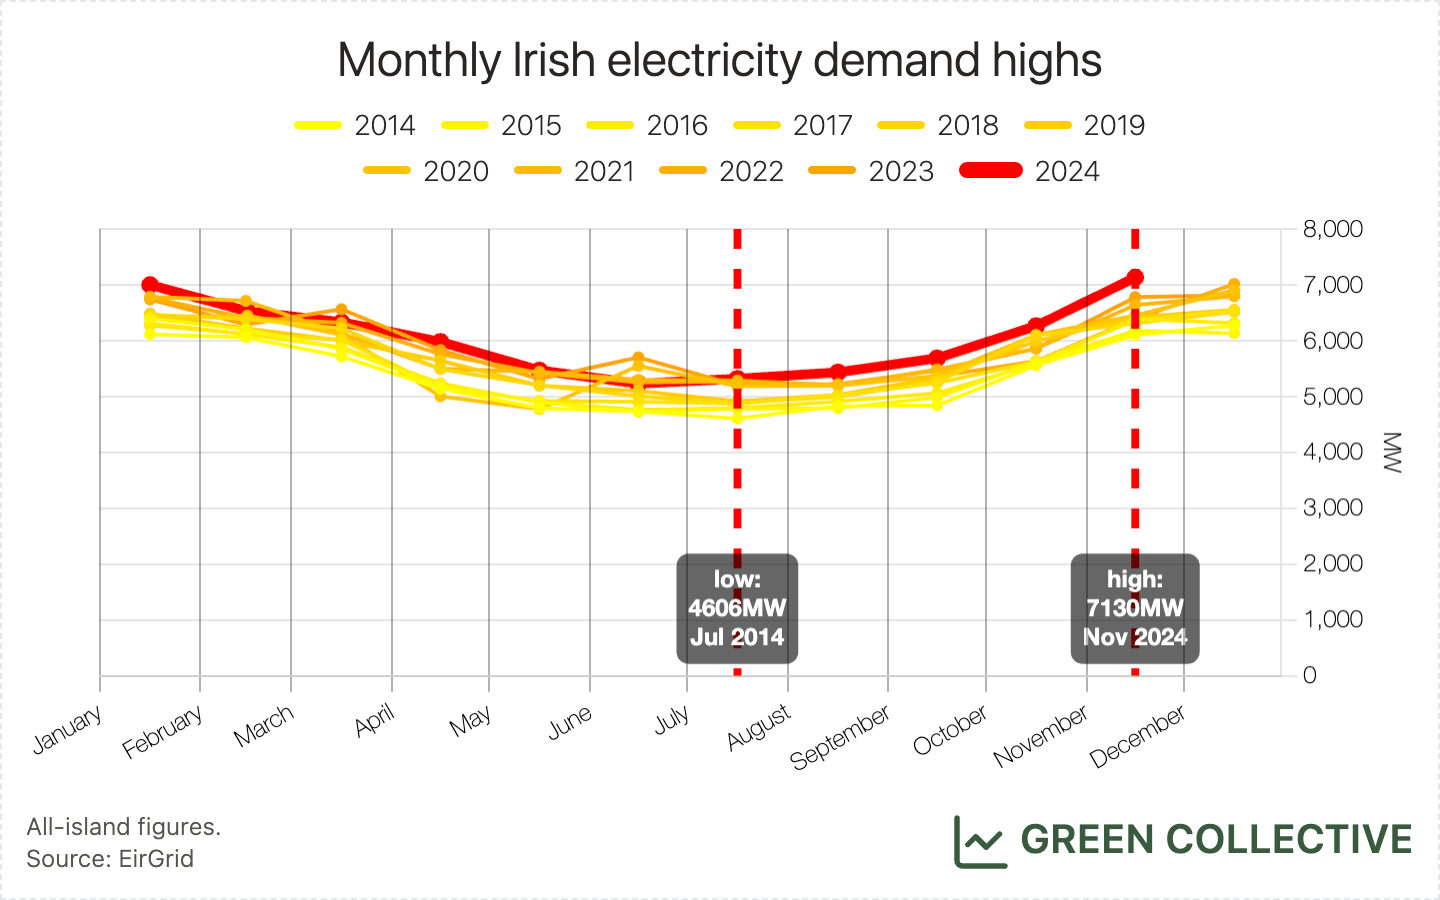
- All-island demand has reached new all-time highs: on Wednesday November 27, demand reached 7130MW. As the chart below illustrates, while demand is seasonal and ever-rising, it has been rising faster than normal in the second half of 2024. We fully expect this record to be broken again later in the winter.
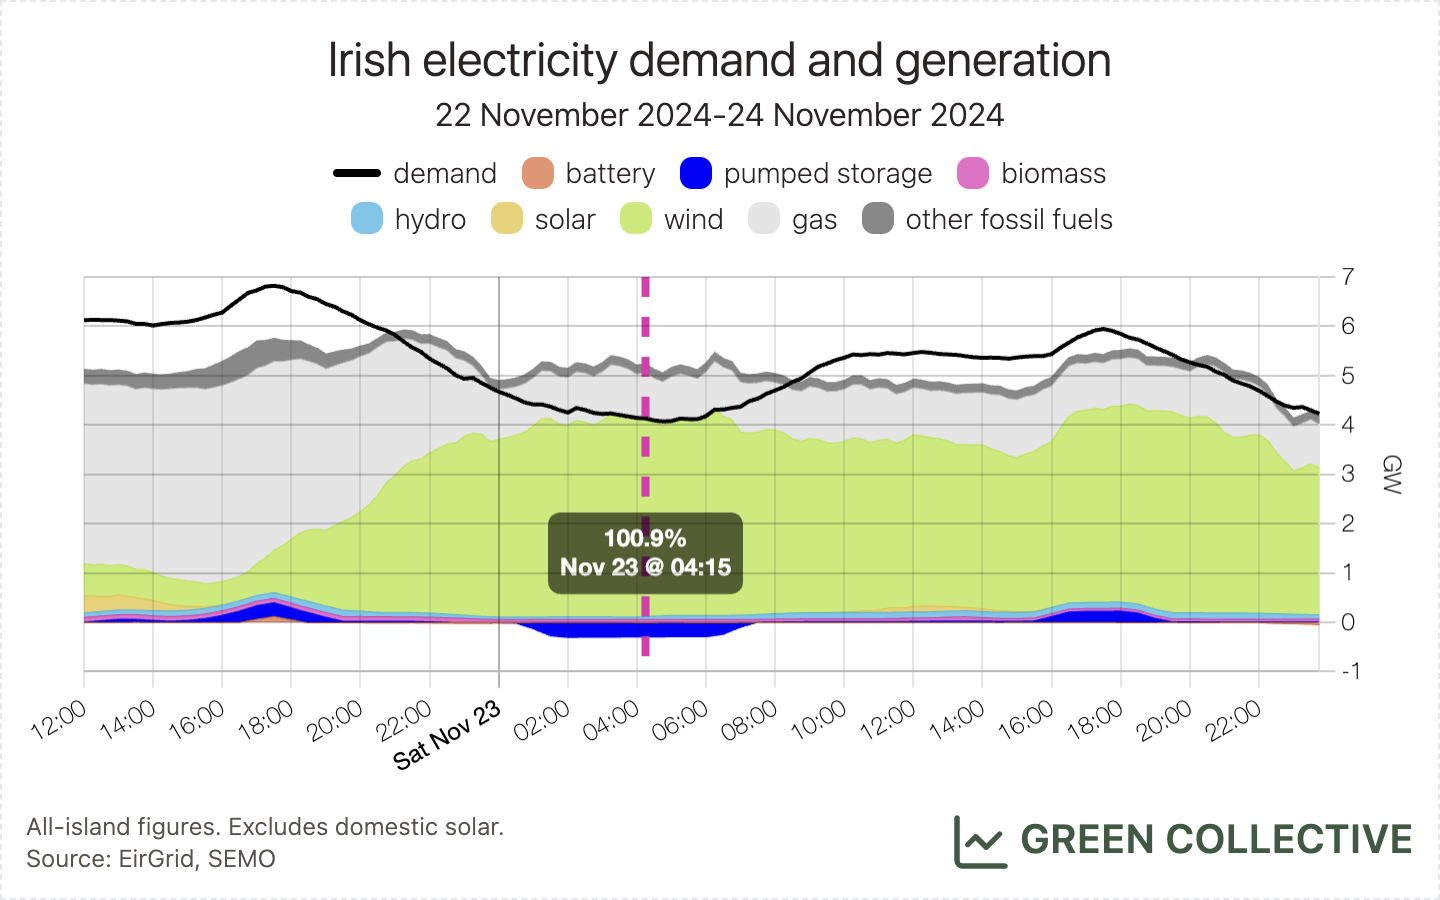
- In the early hours of Saturday, November 23, renewable generation briefly exceeded 100% of electricity demand for the first time since March. Although there's nothing particularly significant this (and there was still plenty of gas being burned at the time, for grid stability), we always like to highlight these events in order to encourage folks to imagine a future where the island is regularly generating enough clean electricity to meet its needs while exporting to its neighbours.
