I have been meaning to add 30-minute grid carbon intensity estimates to our data streams for a while now and I am happy to share results from our beta version along with comparisons against existing official emissions data and our detailed methodology. For the purpose of this exercise, grid carbon intensity is defined as grams of CO2 emissions per kilowatt hour (gCO2/kWh).
Results based on our methodology calibrate quite well with existing data sources for historical Irish grid carbon intensity. While there are ways in which our assumptions could be improved subject to data availability, the current version can already provide value as a granular source of grid carbon intensity.
With this detailed and consistent tracking of grid carbon intensity, electric vehicle owners can get a better idea of the environmental impact of charging, businesses can better benchmark sustainability practices, and battery energy storage providers can showcase their ability to shift cleaner electricity, just to name a few use cases that come to mind.
We will continue to explore ways to improve our grid carbon intensity estimates and suggestions are welcome. In the meantime, we will start including this feature in our weekly reports. Below is is an example. If you are interested in accessing historical granular grid carbon intensity data, feel free to send us a message via email!
Exhibit 1: All-island generation breakdown and grid carbon intensity, 15 to 21 April 2024

Existing data sources for historical Irish grid carbon intensity
Before diving into our methodology, I aggregated a list of publicly available data points on emissions from electricity generation. These reference points below are the ones with which I calibrated our results (if I missed any existing sources, please let me know):
- EirGrid’s Smart Grid Dashboard has a CO2 tab which lists the latest CO2 intensity, today’s lowest CO2 intensity, and the latest CO2 emissions in tCO2 per hour. One can also change location and get data points for all-island, Ireland, and Northern Ireland. These data streams are updated every 15 minutes but it’s quite difficult to backtrack some data and others have noticeable gaps.
- The Environmental Protection Agency of Ireland (EPA) reports the emission intensity of electricity generation on an annual basis. In July 2023, the EPA released a press release stating the average grid carbon intensity was 331gCO2/kWh in 2022.
- The Sustainable Energy Authority of Ireland (SEAI) provides critical input into the EPA’s greenhouse gas inventory calculation as a basis for emission results. The SEAI also reports grid carbon intensity on an annual basis. Its Energy in Ireland 2023 Report states the carbon intensity of Ireland’s electricity was 332gCO2/kWh in 2022.
I assume the annual average values from the EPA and SEAI are for the Republic of Ireland (ROI) only. It’s also important to note the all-island annual average should be very close to that of ROI-only.
Green Collective’s estimated grid carbon intensity
Based on 30-minute generation data and the assumed emission factors by fuel type (methodology detailed in the next section), I estimated the average grid carbon intensity of 2022 to be 337gCO2/kWh in ROI, which is quite close to what’s reported by the EPA (331gCO2/kWh) and SEAI (332gCO2/kWh). The chart below shows fossil and non-fossil generation, along with granular and average carbon intensity in 2022.
Exhibit 2: Generation mix and grid carbon intensity in ROI, 2022

While annual average results based on our methodology calibrate well with official numbers from the EPA and SEAI, I wanted to make sure granular estimates in 30-minute intervals pass the sanity test as well. I collected recent 15-minute emissions data from the Smart Grid Dashboard from 8 April to 12 April 2024. I only managed to get all-island data, because the dashboard wouldn’t load ROI data when I tried. The chart below compares a comparison of grid carbon intensity levels between our calculations and EirGrid’s Smart Grid Dashboard input. Data gaps from the Smart Grid Dashboard are shown as well.
Exhibit 3: All-island grid carbon intensity comparison, 8 April to 12 April 2024

I am happy to see our estimates track more or less well with the Smart Grid Dashboard. However, I haven’t been able to explore reasons behind the gaps, as there is a lack of documentation on the Dashboard in terms of methodologies for producing these 15-minute emissions datasets.
Neither the EPA nor SEAI has yet released an official annual average grid carbon intensity for 2023. Preliminary numbers I have seen include 259gCO2/kWh (from SEAI’s Energy in Ireland 2023 Report) and 280gCO2/kWh (from this LinkedIn post by Professor Paul Deane). To compare, our calculations show average grid carbon intensity decreased from 337gCO2/kWh in 2022 to 269gCO2kWh in 2023.
Exhibit 4: Generation mix and grid carbon intensity in ROI, 2023
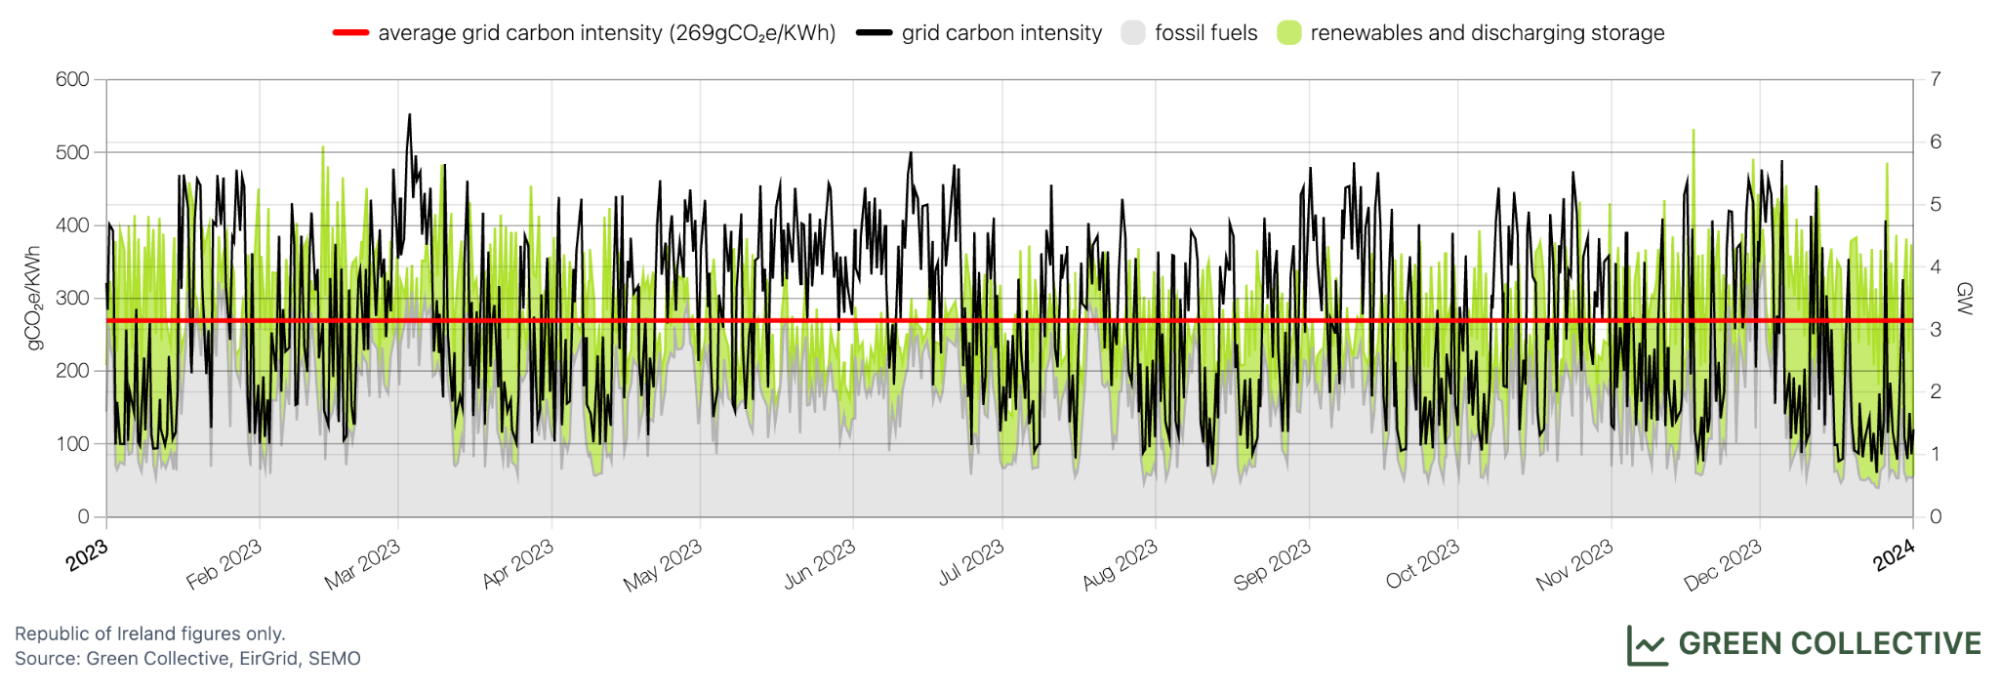
The drop in grid carbon intensity from 2022 to 2023 is due to decreased fossil fuel generation and increased imports. As illustrated below, all types of fossil fuel generation decreased, while imports increased considerably due to lower carbon prices in the UK compared to the EU. Based on national carbon budget rules, imported electricity is considered emission free.
Exhibit 5: All-island fossil fuel generation and imports, 2022 and 2023

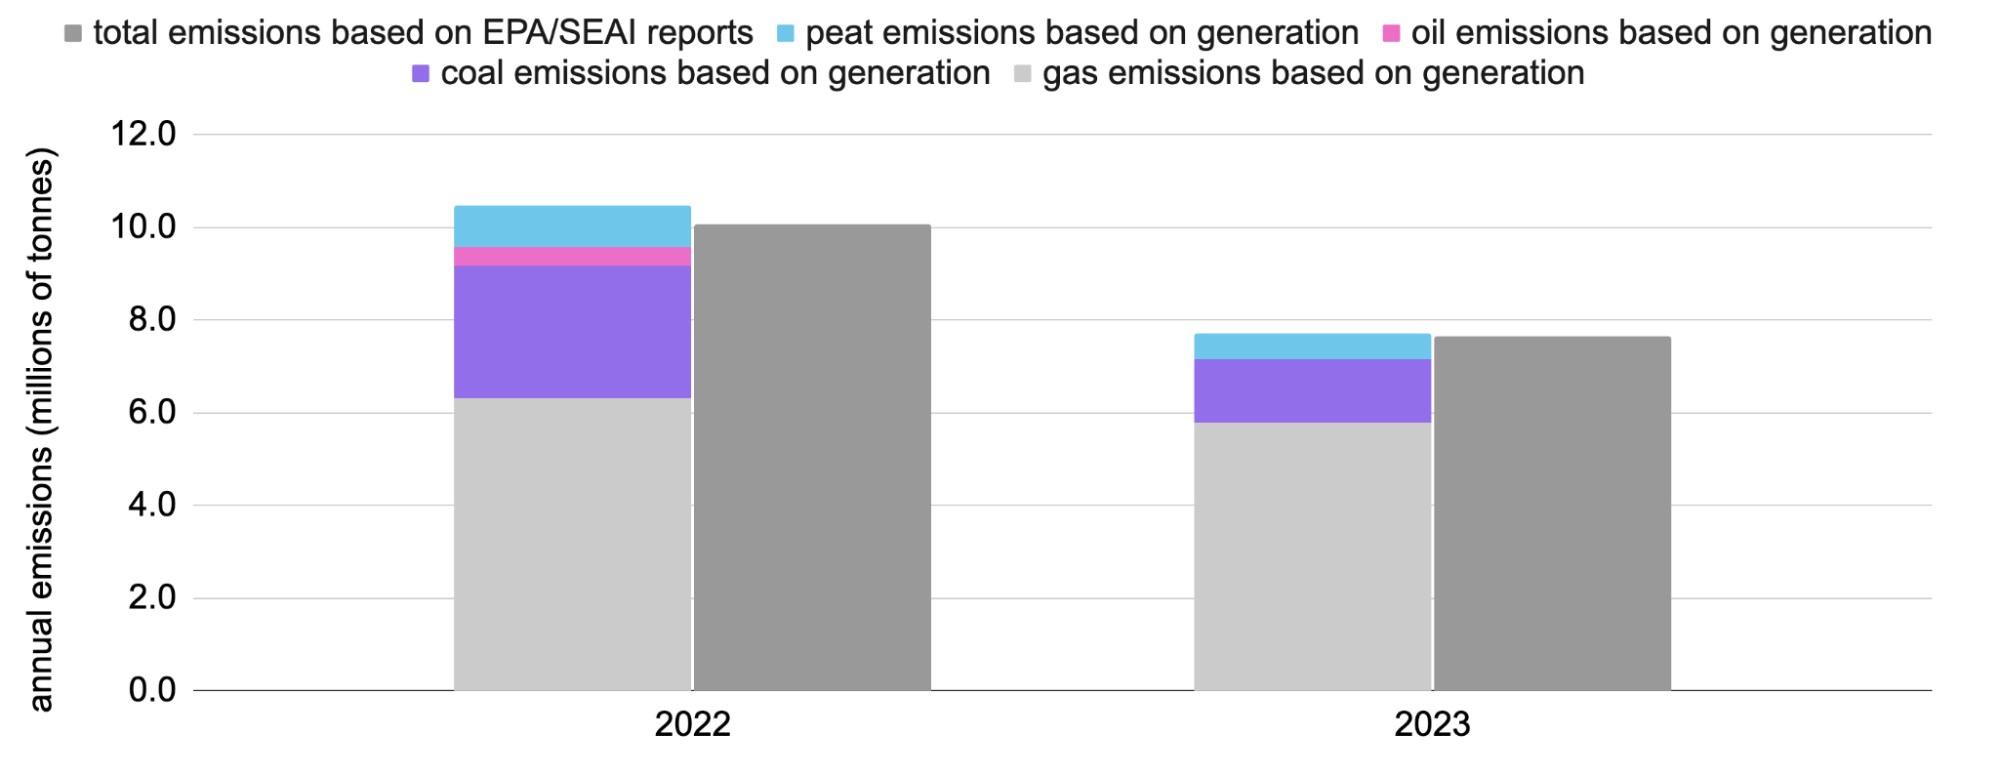
While the EPA hasn’t published the grid carbon intensity of 2023 yet, it recently released some data points on total emission reductions that I could use as benchmarks. According to an RTE article on 6 April, annual total emissions from electricity generation fell by nearly 24% from 2022 to 2023. SEAI’s key statistics show CO2 emissions from electricity generation in 2022 was 10.1 million tonnes.
I calculated emissions by fuel type based on the same assumptions used earlier to produce grid carbon intensity, shown as the stacked bars below. Compared to emission levels reported by the EPA and SEAI, our emission levels are 3.9% higher in 2022 and 0.9% higher in 2023. Our calculations show emissions decreased by 26%, compared to the 24% from the EPA cited by RTE.
Exhibit 6: Calibration of emissions from electricity generation in ROI, 2022 and 2023
Although the current version of this grid carbon intensity tracker has promising calibration results, there are additional data streams that could potentially improve the feature. These include fuel consumption data, generator-level emission monitoring data, site-specific heat rate information by fuel type, and so on. We will continue to update our methods subject to data availability. In the meantime, our methodology is documented below.
Green Collective’s methodology
Generation levels
To produce reasonable estimates, at bare minimum you will need total generation and unit-level generation data of all fossil fuel capacity. EirGrid publishes near real-time total generation at 15-minute intervals via the Smart Grid Dashboard. To the best of my knowledge, unit-level generation data published by the Single Electricity Market Operator (SEMO) covers all fossil fuel capacity. Unfortunately, it’s published with at least one day's delay. An alternative source of unit-level generation is ENTSO-E which suffers from a similar delay in publishing and is missing some fossil fuel capacity. For this exercise, generation data from SEMO is used as input.
Fuel-specific emission factors in gCO2/kWh
Ideally, generator-level fuel consumption data should be used to derive the most accurate assumptions of different units’ emission factors, since some units can burn a combination of fossil fuels. I believe generators with greenhouse gas emission permits are required to report fuel consumption data to the EPA, but I haven’t been able to locate publicly available sources for such data.
As fuel consumption data proves to be elusive, I simplified the problem by assigning each emitting generator a primary fuel, even when it uses multiple fuels. This involved looking up old compliance reports for certain generators to confirm the primary fuel.
Then I tried to look for emission factors for different fuels and found EPA’s annually updated CO2 emission factors. However, without knowing site-specific heat rates, these emission factors in tCO2/TJ are not of much use for this exercise.
In an act of desperation, I went to the United States EPA’s Emissions & Generation Resource Integrated Database (eGRID) which includes environmental characteristics of almost all electric power generated in the US. Fun fact: I started my career in the energy space as a junior energy modeler simulating the impact of US federal and state-level environmental regulations on power plants and I will forever remember eGRID.
I assume a fossil fuel power plant in the US would not be too different from that in Ireland. With plant-level annual emissions and net generation levels for 2022 in eGRID database, after taking out some outliers of outrageously polluting sites, I calculated an average emission factor for gas, oil, and coal. The Irish EPA’s emission factors did end up being handy, because I needed them to calculate the emission factor for peat.
Here are the emission factors by primary fuel type used in Green Collective’s calculations:
- peat: 1,373gCO2/kWh
- coal: 1,022gCO2/kWh
- oil: 917gCO2/kWh
- gas: 412gCO2/kWh
If you have any questions or suggestions regarding our methodology, please reach out!